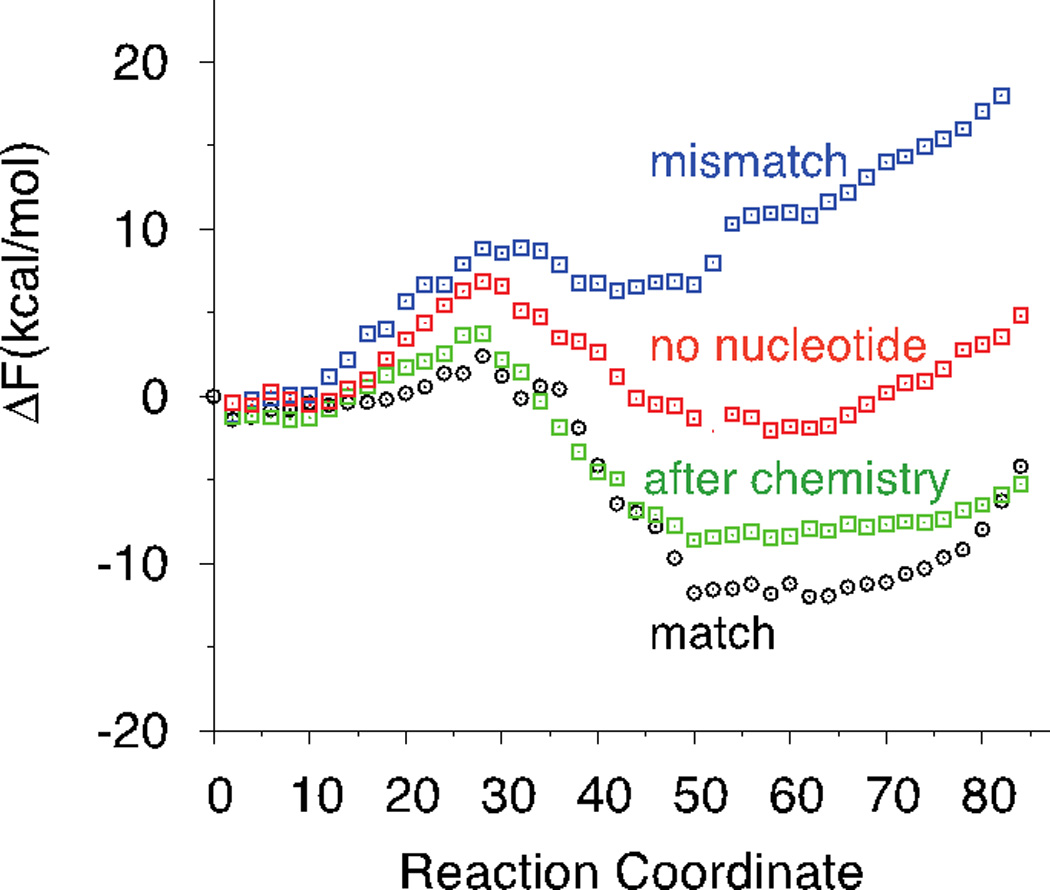
Figure 4.

Potential of Mean Force along the open to closed transition of the HIV RT. Each color represents the PMF with a different substrate bound Correct Nucleotide TTP (Black), Mismatch dATP (Blue), Correct Nucleotide after addition to the growing strand and release of pyrophosphate group (Green), and No nucleotide (Red).
