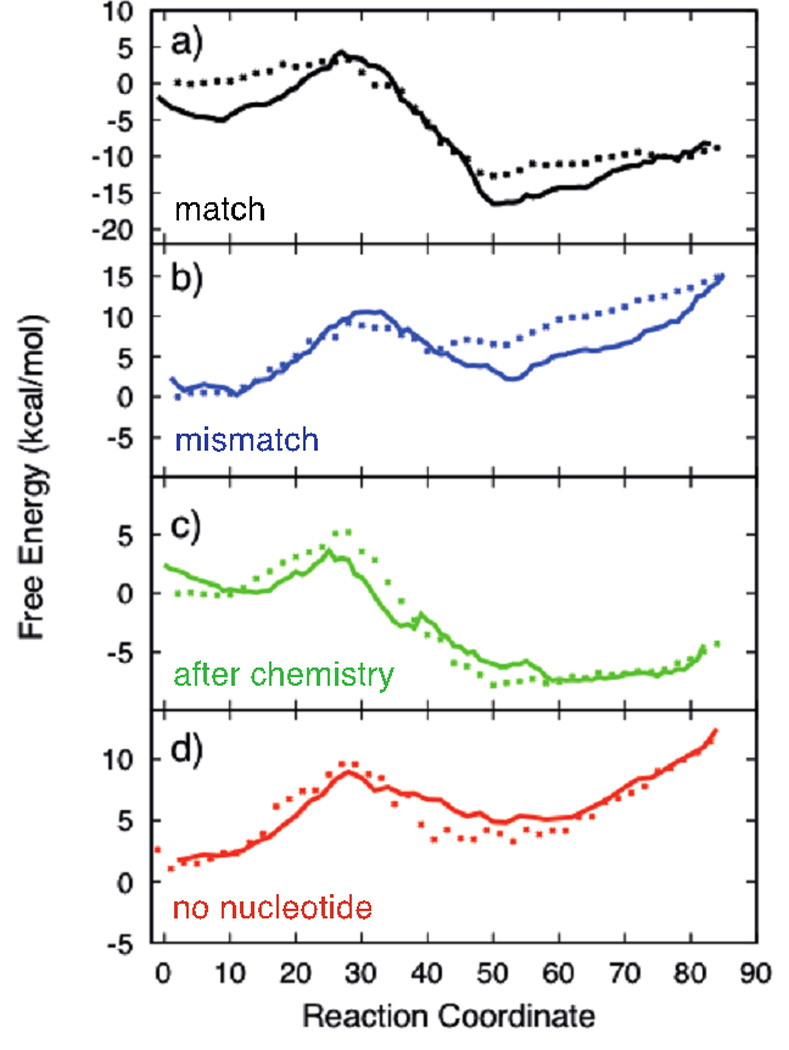
Figure 5.

Comparison of the free energy calculations along the enzyme conformational transition pathway with different binding modes of incoming substrate using the two different methods: Points are computed from the average of the projection of force along the path (PMF), Solid lines are the free energy estimates from the stationary probability of milestones computed from unconstrained molecular dynamic simulations. The plots correspond to different substrates: a-Correct nucleotide bound, b-Mismatch bound, c-Correct Nucleotide after pyrophosphate release, d-No Incoming nucleotide bound.
