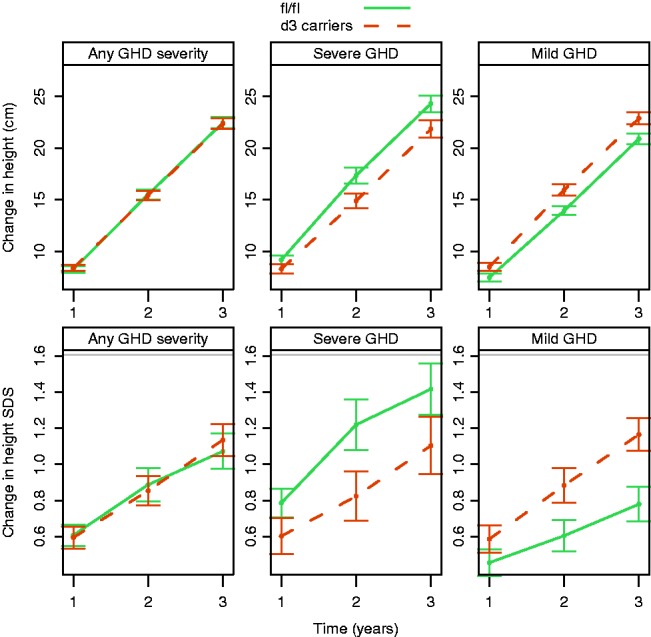
Figure 1.

Change from baseline in height over time. Top panels show change in height (cm) and bottom panels show change in height SDS. Lines correspond to mean and error bars show the standard error of the mean. The interaction between GHRd3 polymorphism and GHD severity was significant for both endpoints (P=0.0018 and 0.010, respectively, for change in cm and SDS). GHD, growth hormone deficiency.

 This work is licensed under a