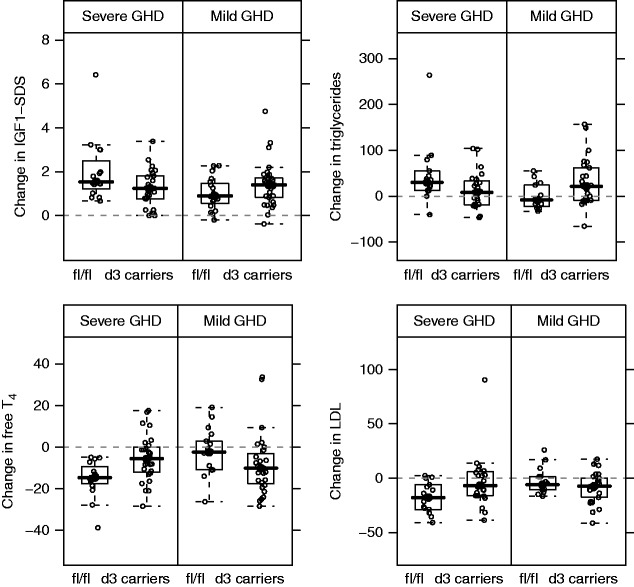
Figure 2.
Change in serum biomarkers after 1 month of r-hGH therapy. Panels from top left to bottom right correspond to boxplots for change in IGF1 SDS, percentage change in fasting triglycerides (unit of measurement: mmol/l), percentage change in free T4 (pmol/l), and percentage change in fasting LDL-cholesterol (mmol/l). All interaction GHRd3 polymorphism–GHD severity terms were significantly associated with biomarker changes (FDR <5%). GHD, growth hormone deficiency; IGF1, insulin-like growth factor-I; T4, thyroxine.

 This work is licensed under a