Figure 4.
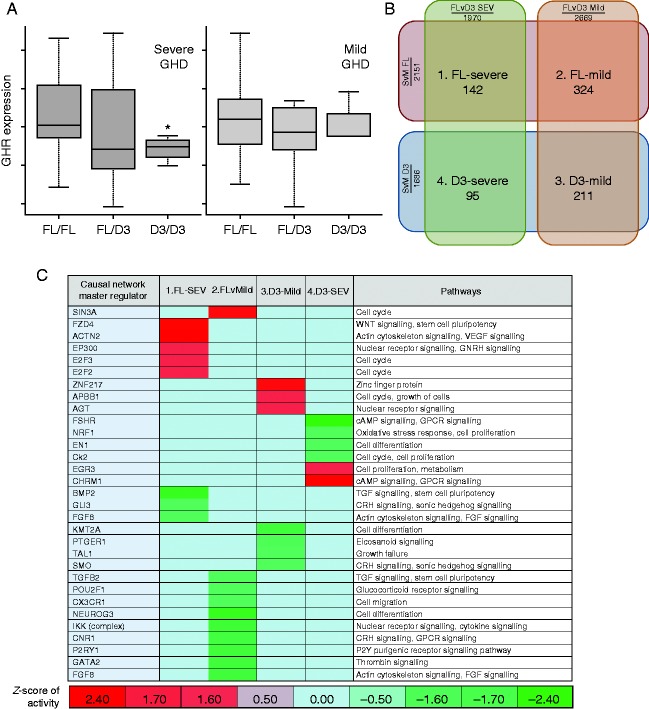
Gene expression associated with GHD severity and carriage of the GHRd3 variant. (A) Box and whisker plots of GHR expression by genotype (median and quartiles of Affymetrix probe-set 205498_at expression) (B) Diagram showing overlap of associated gene expression with severe compared to mild GHD and carriage of full length GHR compared to carriage of GHRd3 (P<0.05, numbers represent associated gene probe sets). (C) CNA was used to define master regulators associated with the regulation of the overlapping gene expression defined in (B) (modified P value <0.05 and z-score of activity >|1.4|). Data represented as a heat map with hierarchical clustering (Euclidean metric); biological pathways associated with master regulators are shown. The colour coding represents the predicted level of activity of the master regulator – deeper red represents increasing up-regulation (e.g. ACNT2) and deeper green represents increased down-regulation (e.g. BMP2).

 This work is licensed under a