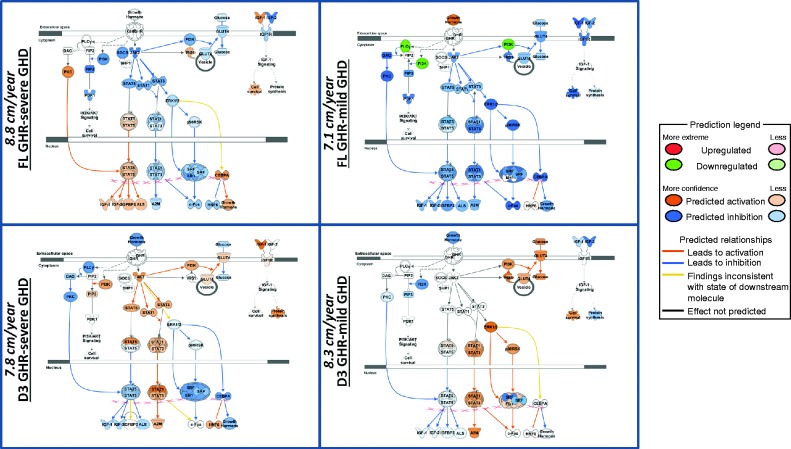
Figure 5.
Predicted activity within the GH signal transduction pathways based on baseline gene expression. Each panel shows the signalling molecules in the GH pathways. The predicted level of expression (Orange, increased; Blue, decreased) of each of these molecules for each of the four GHRd3/GH status groups (FL-GHR-Severe GHD (38 genes), FL GHR-Mild GHD (64 genes), GHRd3-Mild GHD (48 genes), GHRd3-Severe GHD (20 genes)) is shown. The predicted levels of expression in the GH pathway are derived from the impact of the levels of baseline gene expression in each of the four states and their direct network interactions with the GH pathway. First year height velocity (cm/year) in each of the four states is shown in the left margin of each panel. The predicted action on the GH pathway molecules was determined using Molecular Activity Prediction (MAP) tool in IPA (see Legend below). The principal difference between GH deficient states for those with full-length GHR (top two panels) is that those with severe GHD are predicted to have an activated STAT5 pathway in the basal state. For carriage of GHRd3 (lower two panels), those with severe GHD are predicted to have inhibition in the ERK pathway in the basal state. When comparing between genotypes for both severe and mild GHD, those carrying GHRd3 have active STAT 1 and 3 pathways compared to inhibition for those with full-length GHR.

 This work is licensed under a