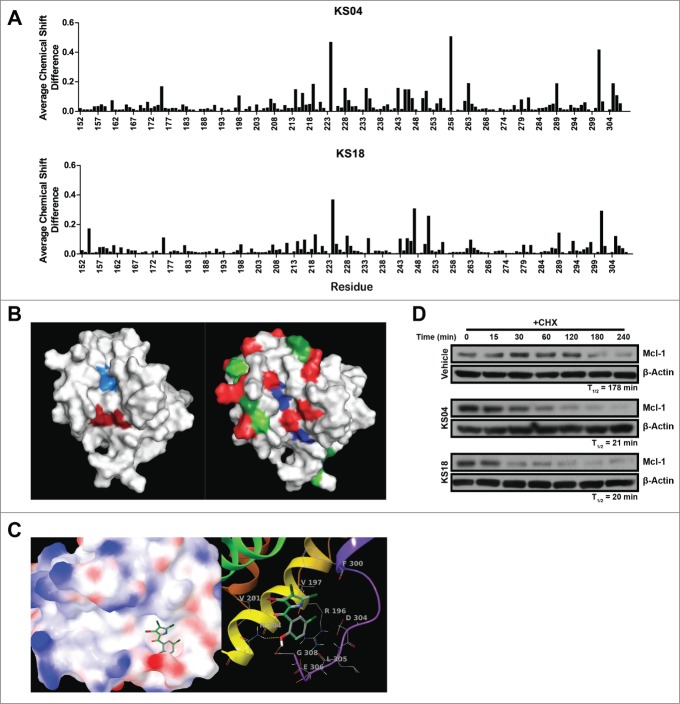
Figure 1.
Pyoluteorin derivatives bind to and induce Mcl-1 degradation. (A) Plot of average chemical shift differences in the spectra of 15N-labeled Mcl-1 upon titration with KS04 (top) and KS18 (bottom). (B) Pockets p2 (left, light blue) and p4 (left, dark red) are indicated on the NMR structure of Mcl-1 complexed with Noxa. The same NMR structure of Mcl-1 is also indicated with residues which demonstrate significant average chemical shift differences according to NMR spectroscopy for all of maritoclax, KS04, and KS18 (right, blue), both KS04 and KS18 (right, red), KS04 alone (right, light green), and KS18 alone (right, dark green). (C) The structure of KS04 and KS18 computationally docked to Mcl-1 by GLIDE. Blue and red colors of the molecular surface represent positive and negative potentials respectively. The carbon atoms of KS04 are colored gray and those of KS18 green. Chlorine atoms are colored dark green, bromine atom purple, oxygen atoms red, nitrogen blue, and polar hydrogen white. Non-polar hydrogen atoms are not shown. Left: The pyrrole group of the KS compounds docked in the p4 pocket of the molecular surface of Mcl-1 with their phenol group extended to the tail region of Mcl-1 helix 8. Right: Hydrogen bonding and amino acid residues near the predicated binding site of KS compounds. Mcl-1 backbone is represented by red to purple ribbons from N-terminus to C-terminus. Two hydrogen bonds between KS compounds and Mcl-1 are shown as yellow dotted lines. (D) U937 cells were treated with vehicle, 2.5 μM KS04 or 2 μM KS18 for 1 hour before adding 10 μg/ml CHX and collecting cells at the indicated times. Protein levels were detected by immunoblotting and quantified by densitometry.

