
Figure 6.
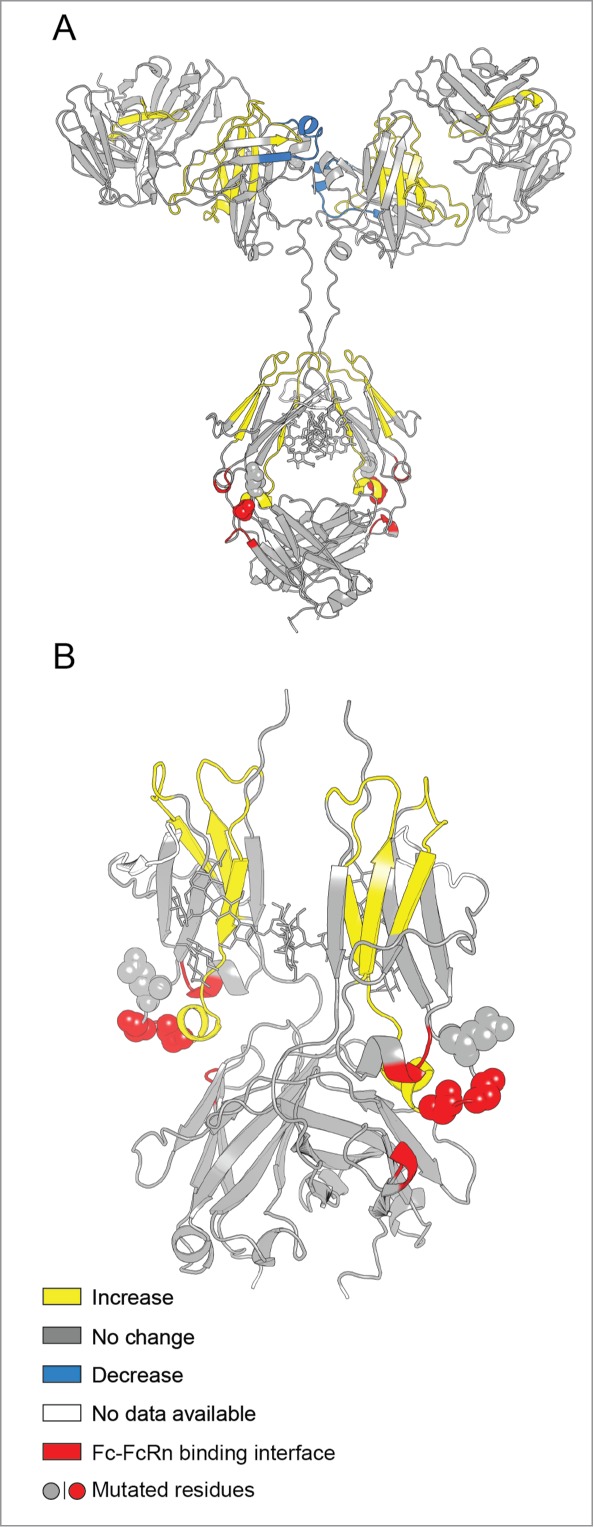
Effect of the YTE mutation (mAb-E) on the local flexibility of the native mAb (mAb-A) at pH 6.0 as measured by H/D-MS plotted on the homology models of (A) intact mAb-A and (B) Fc domain of mAb-A. Changes in flexibility of particular peptide segments are colored as shown in the legend and are derived from the differential exchange data shown in Figure 4.