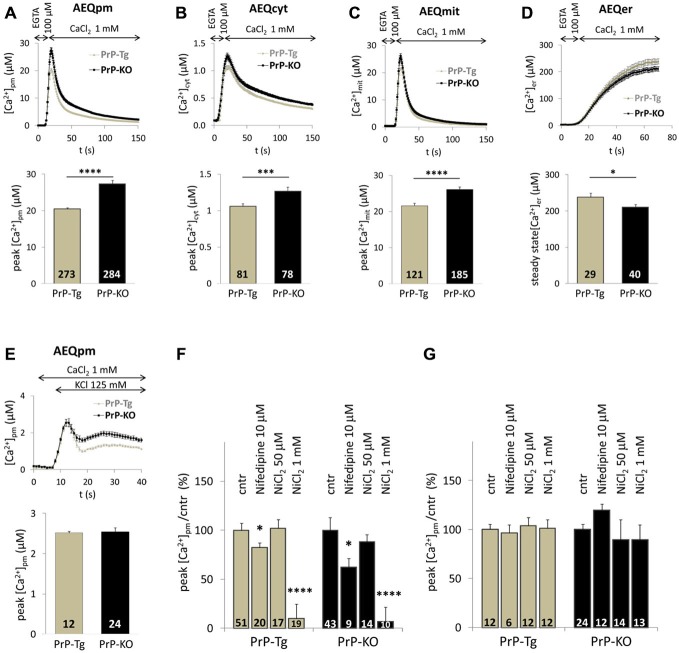
Figure 1.
PrPC regulates Ca2+ movements in different cell domains of cerebellar granule neurons (CGN) after stimulation of SOCE. (A–C) PrP-KO CGN (black) have higher Ca2+ fluxes than control PrP-Tg CGN (gray) in the cytosolic domains proximal to the plasma membrane (PM) (A), the bulk cytosol (B) and the mitochondrial matrix (C), as measured by the appropriate AEQ probe. Upper panels report the kinetics of local [Ca2+] transients, while the bar diagrams of the corresponding [Ca2+] peaks are shown in the lower panels. Here and after, the number of replicates (n) is indicated inside each bar diagram. (D) The steady-state [Ca2+] level in the endoplasmic reticulum (ER) lumen of PrP-KO CGN is significantly lower than in PrP-Tg CGN. In (A–D), SOCE was activated by treating neurons with the Ca2+ chelator EGTA to deplete Ca2+ reservoirs. (E) Activation of VGCC by the 125 mM K+-depolarizing solution provokes similar [Ca2+]pm transients and peaks in both CGN genotypes. (F,G) VGCC inhibitors (nifedipine and NiCl2) lower VGCC-induced [Ca2+]pm peaks (F), but leave unchanged those following SOCE (G). *p < 0.05, ***p < 0.001, ****p < 10−5, Student’s t-test.

