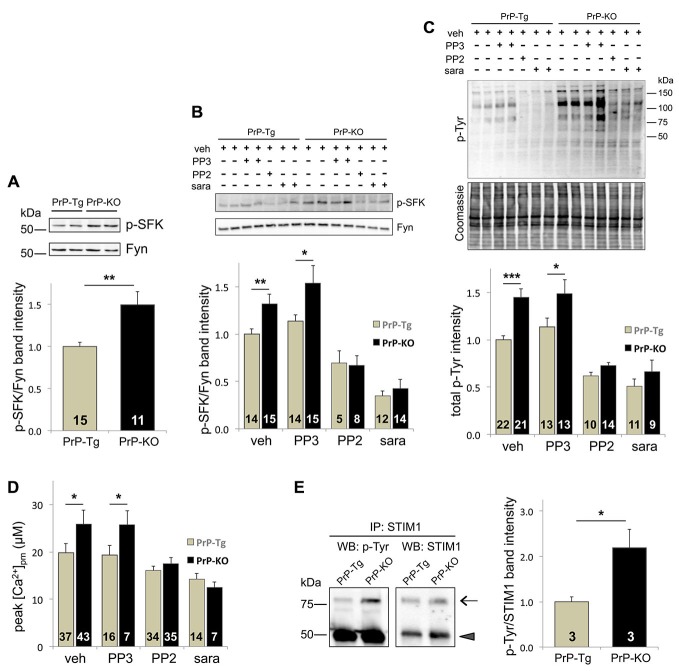
Figure 2.
The Tyr-kinase Fyn is the link between PrPC and SOCE. (A) PrPC reduces the level of active Fyn, as evident from both the representative WB (upper panel) of PrP-Tg and PrP-KO CGN probed with an antibody to p-SFK or total Fyn (both run in duplicate), under SOCE-activating conditions (Ca2+-depleted stores), and the corresponding densitometric analysis of p-SFK immunosignals normalized to that of total Fyn (lower panel). Contrary to other neuronal SFK members (Supplementary Figure 4), the identical apparent mass of p-SFK and Fyn indicates that the Fyn band corresponds to the p-SFK band. Similar results were obtained under basal conditions, i.e., with Ca2+-filled stores (see Supplementary Figure 3). (B,C) Addition (+) of the SFK inhibitors saracatinib (sara, 5 μM) and PP2 (10 μM), but not of PP3 (10 μM), reduces the level of both p-SFK (B) and total Tyr-phosphorylated (p-Tyr) proteins (C) of CGN compared to the untreated (−) samples. (B) The upper panel reports a representative WB of the two neuronal genotypes treated with, or without, the SFK inhibitors, and immunostained as in (A), while the lower panel shows the corresponding densitometric analysis of p-SFK normalized to the band intensity of total Fyn. Veh (vehicle) indicates the control experiment run in the presence of DMSO (0.1%). (C) The upper panel reports the WB of total p-Tyr proteins present in the two CGN genotypes treated as in (B). In the corresponding densitometric analysis (lowest panel), the p-Tyr band intensity was normalized to that of the Coomassie blue-stained bands (middle panel). (D) Only saracatinib and PP2 decrease SOCE-induced [Ca2+]pm peaks, and abrogate the difference observed in control (veh-treated) PrP-Tg and PrP-KO CGN. (E) STIM1 is more abundantly Tyr-phosphorylated in PrP-KO CGN than in PrP-Tg CGN under SOCE-stimulating conditions. This is evident from the representative WB (left panel) of immunoprecipitated (IP) STIM1 probed with an antibody to either p-Tyr or total STIM1 (arrow), and from the corresponding densitometric analysis (right panel) reported as the ratio between the p-Tyr band intensity and the STIM1 band intensity. The arrowhead in the left panels indicates the immunosignal of the mouse IgG used in the immunoprecipitation assay. On the left of the WB, MW standards are indicated. *p < 0.05, **p < 0.01, ***p < 0.001, Student’s t-test. The analysis of the statistical significance (p-value, Student’s t-test) of data for the comparison between different treatments within each PrP genotype (B–D) is reported in Supplementary Table 2. Other details are as in the legend to Figure 1.

