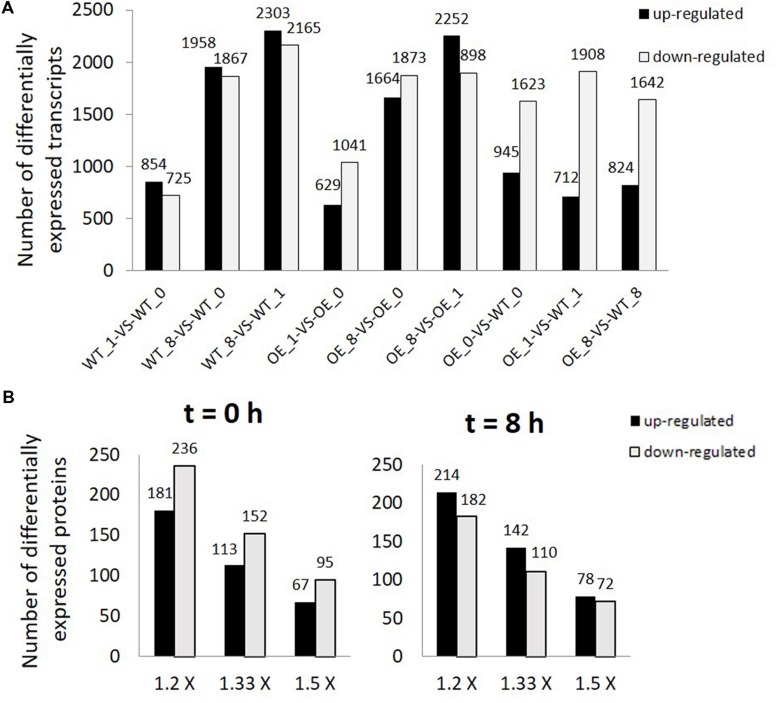
FIGURE 2.
Differentially expressed transcripts and proteins in overexpression (OE) line compared with WT. (A) Number of differentially expressed transcripts (FDR ≤ 0.001, P < 0.001, and FC > 2). WT_0, WT_1, WT_8, OE_0, OE_1, and OE_8 represent WT and OE samples collected at t = 0, 1, and 8 h, respectively. (B) Number of differentially expressed proteins (1.2×: 1.2 fold change, 1.33×: 1.33 fold change, and 1.5 × : 1.5 fold change) between OE and WT samples collected at t = 0 (left) and 8 h (right).

