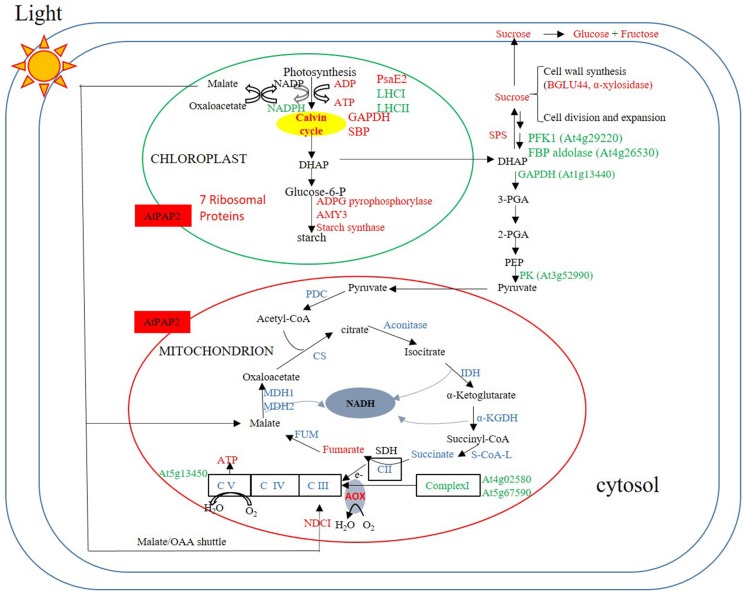
FIGURE 6.
Summary of protein and metabolites data at t = 8 h. Up-regulated proteins and metabolites in the OE line (vs WT) are indicated in red and down-regulated proteins and metabolites are indicated in green color. Undetected proteins and metabolites are indicated in black color. Proteins and metabolites without significant changes are shown in blue color. Under illumination, the abundances of some enzymes in the Calvin–Benson cycle, starch synthesis and sucrose synthesis were higher in the OE line, whereas the abundances of some enzymes in the glycolysis pathway and TCA cycle were lower or unaltered in the OE line. Regarding the respiratory complexes, some Complex I subunits exhibited lower protein abundances, but that of Complex II–V were generally unaltered.

