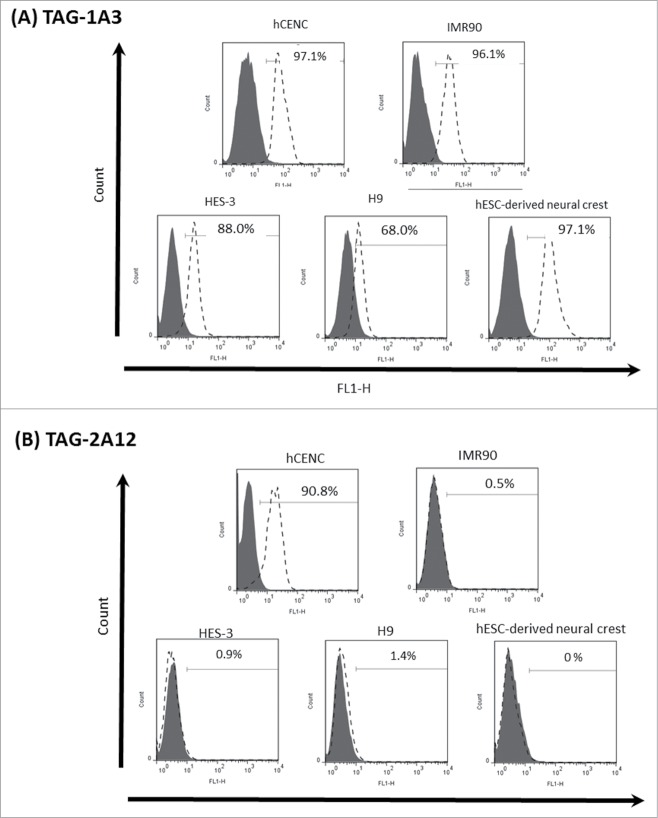
Figure 2.
Histogram analysis of TAG-1A3 and TAG-2A12 on various cell lines. Solid line (filled) represents the isotype control and dotted line (open) represents antibody staining. (A) TAG-1A3 was binding to different cells lines with varying normalized mean fluorescence intensity (nMFI) and higher nMFI values were observed with both hCENC and hESC-derived neural crest cells. (B) TAG-2A12 was found to be binding specifically to hCENC only.

