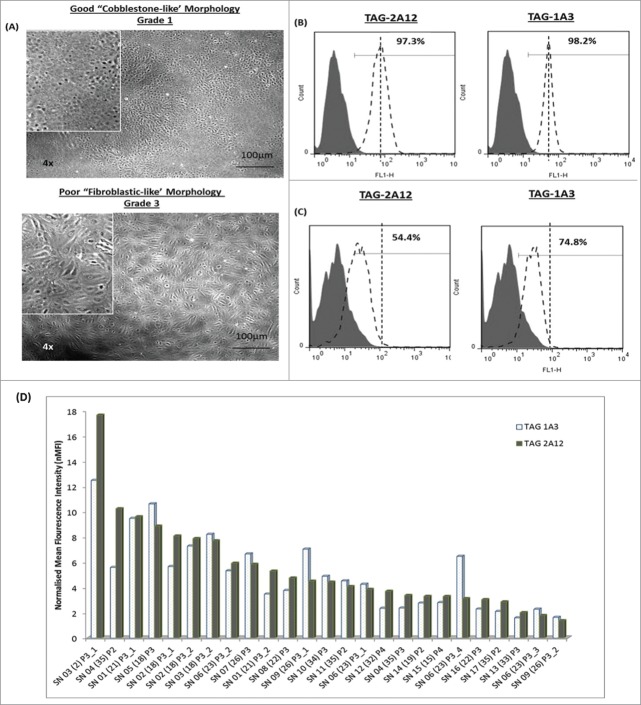
Figure 6.
Characterization of cultured hCENCs with TAG-1A3 and TAG-2A12. (A) Top panel: Cells with ‘cobblestone-like’ morphology and bottom panel: cells with ‘fibroblastic-like’ morphology. (B-C) Expression of TAG-1A3 and TAG-2A12 on the cell surface via flow cytometry analysis. (B) Cells with ‘cobblestone-like’ morphology have high expression of TAG-1A3 and TAG-2A12 than cells with (C) ‘fibroblastic-like’ morphology (D) nMFI levels of TAG-1A3 and TAG-2A12 on various donor samples.

