
Figure 1.
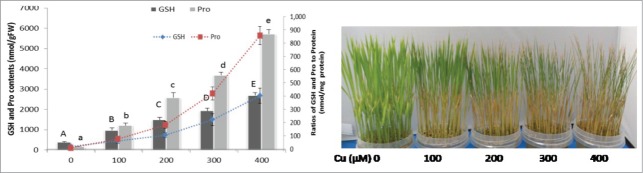
(A) Effect of copper on the levels of GSH and Pro after 72 h of Cu treatment. Bar charts indicate GSH and Pro contents in nmol/g FW whereas line charts indicate ratio of GSH and Pro to protein (nmol/mg of protein). Different letters indicate significant differences between treatments at P < 0.05, according to DMRT. (B) Phenotypical aspects of copper toxicity in hydroponically grown rice seedlings. Fourteen-day-old rice seedlings were treated with 0, 100, 200, 300, 400 μM of CuSO4. Photograph was taken after 72 h of Cu treatment.