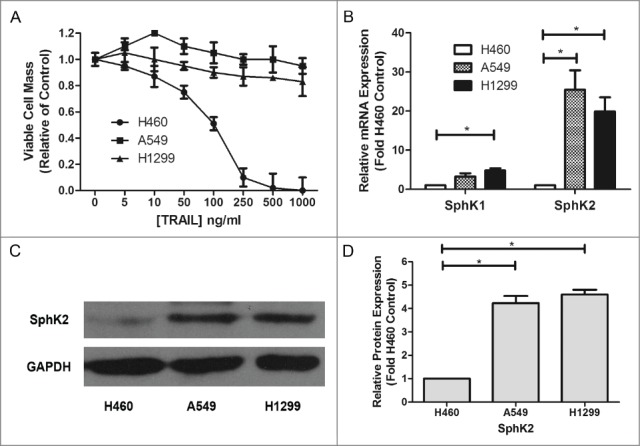
Figure 1.

Dysregulation of sphingosine kinases in TRAIL resistant lung cancer cells. (A) H460, A549 and H1299 cells were plated at 1 × 10⁵/ml cells per well in 96-well plate. The following day cells were treated with indicated concentrations of TRAIL for 24 h. Data are presented as percent of vehicle treated samples. Mean values of 5 different experiments (*p < 0.05). (B–D) qRT-PCR analysis and Western blot for expression of sphingosine kinase isoforms in TRAIL resistant lung cancer cells. Data are expressed as fold-change relative to H460 cell control as normalized to internal GAPDH. Data points and error bars represent the mean ±SEM of 3 independent experiments. Columns represent mean density of 3 different experiments (*p < 0.05)
