
Figure 2.
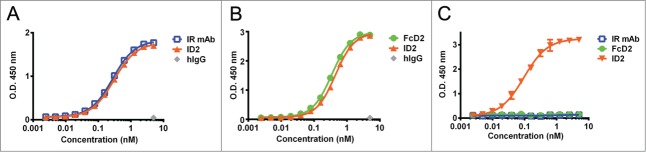
Binding to IGF-IR, VEGF and evidence for co-engagement of both targets by ELISA. (A) ID2 (orange), IR mAb (blue) and human IgG control (gray) binding to human IGF-IR-Fc. (B) ID2 (orange), FcD2 (green) and human IgG control (gray) binding to human VEGF. (C) ID2 (orange), IR mAb (blue) and FcD2 (green) binding to both human IGF-IR-Fc (coated) and human VEGF (detected). Each panel is a representative experiment of at least 3 repeated measurements. The graph is plotted as mean ± SEM (n = 2 ).