
Figure 7.
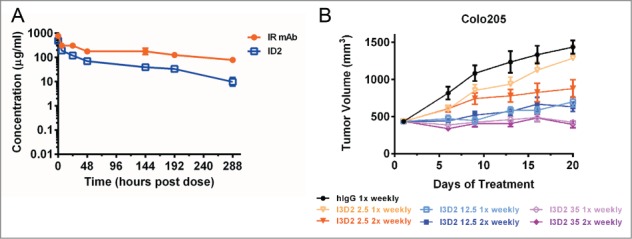
In vivo stability of ID2. (A) Pharmacokinetic assessment of serum concentrations of ID2 and IR mAb as a function time (in hours), following 30 mg/kg intraveneous administration in CD-1 mice (n = 3). Total IgG was used for determining the serum concentrations. The serum concentrations were plotted as mean ± SD. (B) Dose frequency study in a Colo-205 mouse xenograft model. 2.5 mg/kg (orange line), 12.5 mg/kg (blue line) and 35 mg/kg (purple line) of I3D2 (an engineered variant of ID2) were dosed intraperitoneally once weekly (light colored line) and twice weekly (dark colored line) schedules. Tumor volumes are plotted as mean ± SEM (n = 12).