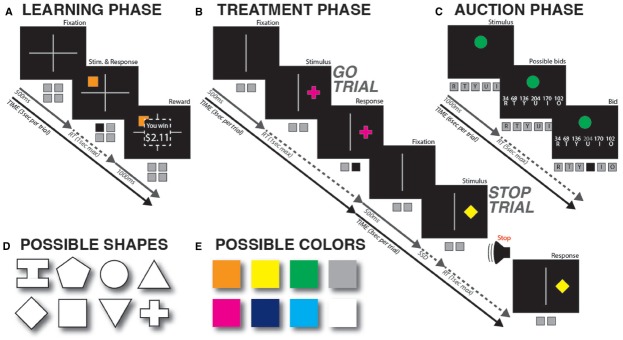
FIGURE 1.

Task diagram. (A) Learning phase. Each shape was repeatedly shown and rewarded according to a pre-defined schedule that associated it with one of four different reward values. (B) Treatment phase. One of the two shapes per value level was paired with stop-signals 75% of the time, while the other was never paired with stopping. (C) Auction phase. Participants repeatedly bid monetary value on each of the shapes from the previous two phases. (D,E) Possible shapes and colors. Colors and shapes were randomly paired for each participant, and the resultant combination was then randomly assigned to one of the four value levels in the learning phase, as well as either the stopping or non-stopping condition in the treatment phase.
