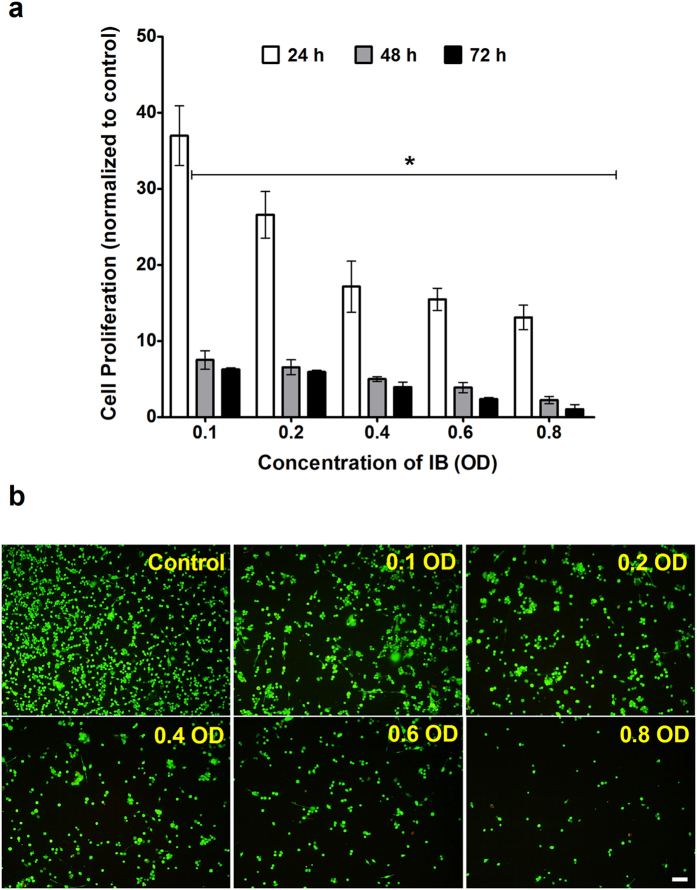
Figure 2. Effect of IB on 2D cell culture.
(a) Cell proliferation with WST-1 assay of 2D culture of CT26 cells exposed to varying concentrations of inactivated bacteria. 0.1 OD = 2.4 × 10⁶ bacterial cells/ml. t-test is a comparison with control. (*p < 0.005) (b) Fluorescence microscopy with Calcein AM and Ethidium homodimer I (EthD-I), of cell viability of CT26 cells after they had been exposed to inactivated bacteria at varying concentrations for 24 hours. Image of cells in top left quadrant of each well. Scale bar represents 200 μm.

