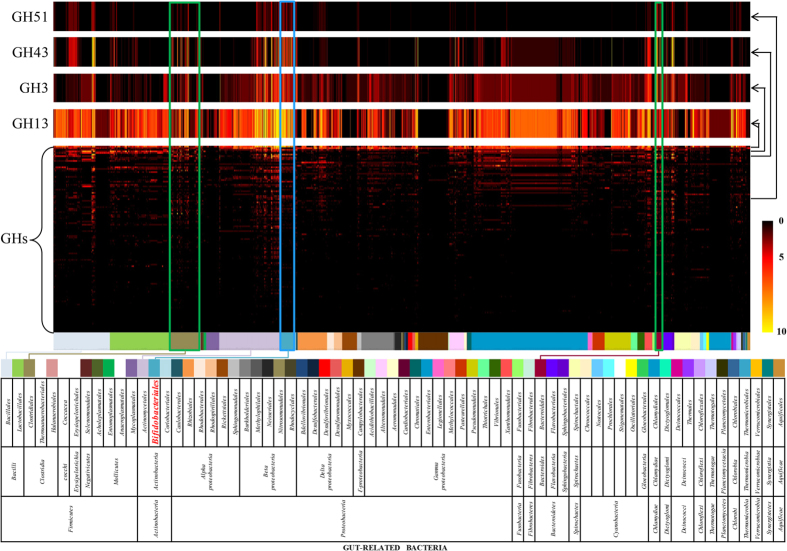
Figure 2. Comparative analysis of bifidobacterial GHs against other gut bacteria.
The central heat map shows GH prediction data of 2721 sequenced bacterial strains belonging to bacterial orders residing in the human gut, identified by different color codes as explained in the underlying table. The four heat map rows, situated above the main heat map, represent an enlarged view of the GH51, GH3, GH43 and GH13 content. Data regarding Bifidobacteriales are highlighted in blue. Data regarding Clostridiales and Bacteroidales are highlighted in green.

