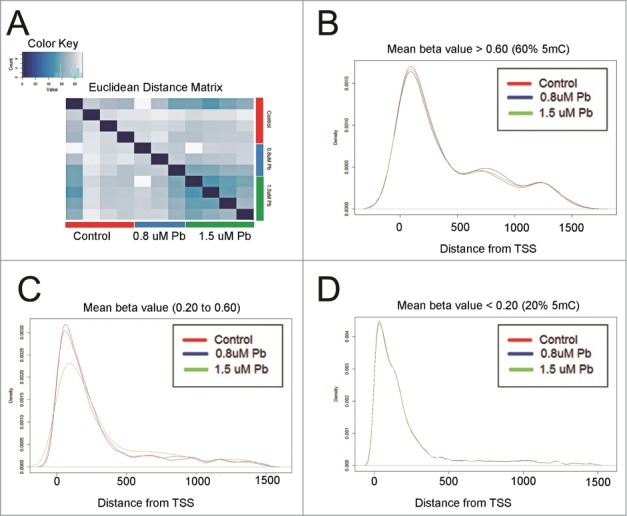
Figure 1.

Characterization of CpG sites in putative 5hmC clusters. (A) Heatmap representation of Euclidean distance matrix between control hESCs and hESCs exposed to Pb (0.8 μM and 1.5 μM for 12929 CpG sites mapping to 1909 hMRs. (B) Distribution of CpG sites with β values ≥ 0.60 or 60% within 1500 bps on either side of transcription start sites. (C) Distribution of CpG sites with β values ≥ 0.20 or 20% and ≤ 0.60 or 60% within 1500 bps on either side of transcription start sites. (D) Distribution of CpG sites with β values ≤ 0.20 or 20% within 1500 bps on either side of transcription start sites.
