
Figure 4.
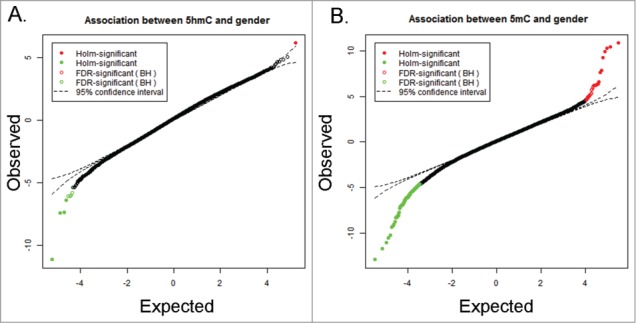
Sex-dependent difference in 5hmC and 5mC clusters. T-plot representation of association analysis based on mixed effect model for single nucleotide difference in (A) 5hmC and (B) 5mC status between males and females in UCB DNA while controlling for blood lead levels (BLL), Socioeconomic score (SES), birth weight, gestational age and smoking status. The results show that a larger number of 5mC sites in UCB DNA is associated with sex rather than putative 5hmC sites.