Figure 3.

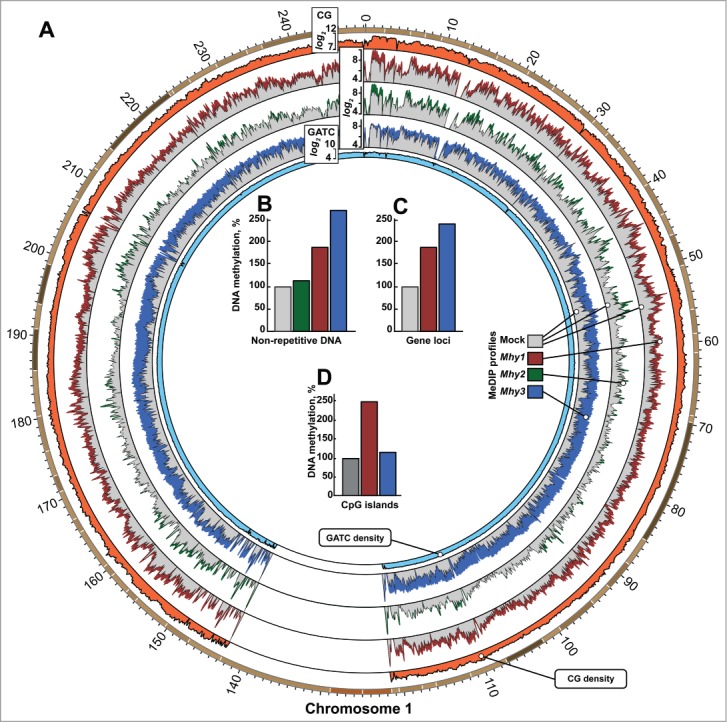
Genome-wide methylation induced by mycoplasma MTases. (A) circular histogram representation of DNA methylation induced by Mhy1 (red), Mhy2 (green), and Mhy3 (blue) in HT1080/Mhy1, HT1080/Mhy2, and HT1080/Mhy3 cells, respectively. For simplicity, the MeDIP profile of human chromosome 1 is shown. The data for human chromosomes 2–22, Y and X are in Figure S3A-O. Histogram bar heights are calculated as logarithms of a number of the individual methylation marks within a 100 kb window (see Extended Experimental Procedures). Gray histograms correspond to methylation in HT1080/mock cells. Orange and light blue histograms indicate relative density of CG and GATC sites within a 100 kb window, respectively. (B-D) bars show the methylation level in HT1080/Mhy1 (red), HT1080/Mhy2 (green), HT1080/Mhy3 (blue), and HT1080/mock cells (gray). Methylation was individually calculated for all non-repetitive genomic sequences (B), genic regions (C), and CPGI regions (D). The percentages were calculated relative to HT1080/mock cells (gray bars = 100%).
