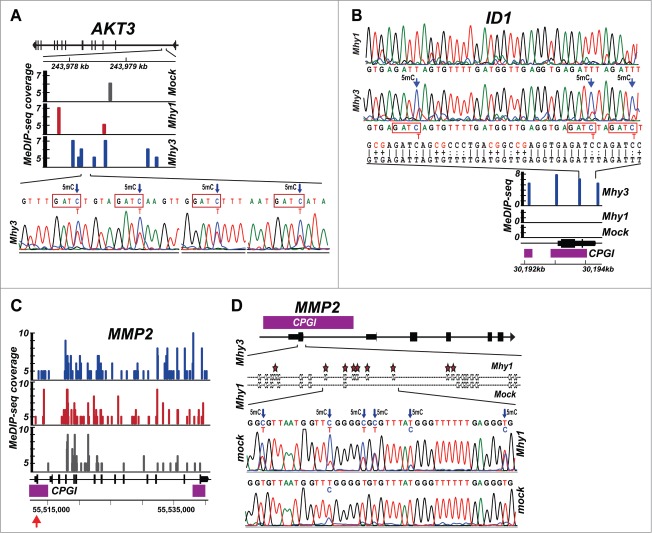
Figure 4.
Methylation of AKT3, ID1, and MMP2 genes. (A) methylation of the AKT3 gene locus. Top, the AKT3 gene locus with exons indicated as vertical bars. Middle, MeDIP profiles. Solid color bars indicate the genomic position and MeDIP coverage of individual CG- and GATC-methylation marks in HT1080/mock (gray), HT1080/Mhy1 (red) and HT1080/Mhy3 (blue) in a 2.5 kb GATC cluster of the AKT3 gene (positions 243977.5–243980 kb on chromosome 1). Bottom, bisulfite sequencing chromatogram of a 218 bp sub-region with 4 GATC sites methylated in HT1080/Mhy3 cells. Arrows indicate 5 mC. (B) methylation of the ID1 gene. Top, bisulfite sequencing chromatogram of a 213 bp sub-region in the promoter of the ID1 gene locus in HT1080/Mhy1 and HT1080/Mhy3 cells. The converted and original genomic sequences are shown under chromatograms. Middle, MeDIP profiles. Solid blue bars indicate the genomic position and MeDIP coverage of the individual GATC-methylation marks in HT1080/Mhy3 cells in a 2.5 kb ID1 gene promoter (positions 30192–30194.5 kb on chromosome 20). No GATC methylation was recorded in HT1080/Mhy1 and HT1080/mock cells. Bottom, ID1 gene locus with exons (solid black bars) and CPGIs (purple bars). (C-D) methylation of the MMP2 gene. C, MeDIP profiles of a 27.5 kb MMP2 gene locus in HT1080/Mhy3, HT1080/Mhy1 and HT1080/mock cells. Solid color bars indicate the genomic position and MeDIP coverage of the individual CG- and GATC-methylation marks in HT1080/mock (gray), HT1080/Mhy1 (red) and HT1080/Mhy3 (blue) cells. CPGIs, purple rectangles. Genomic coordinates are shown at the panel bottom. (D) bisulfite sequencing diagrams of a 221 bp sub-region (indicated by a red arrow in panel C) in the CPGI promoter (purple bar) of the first exon (solid black bar) of the MMP2 gene in HT1080/Mhy1 and HT1080/mock cells. Stars and arrows indicate 5 mC.

