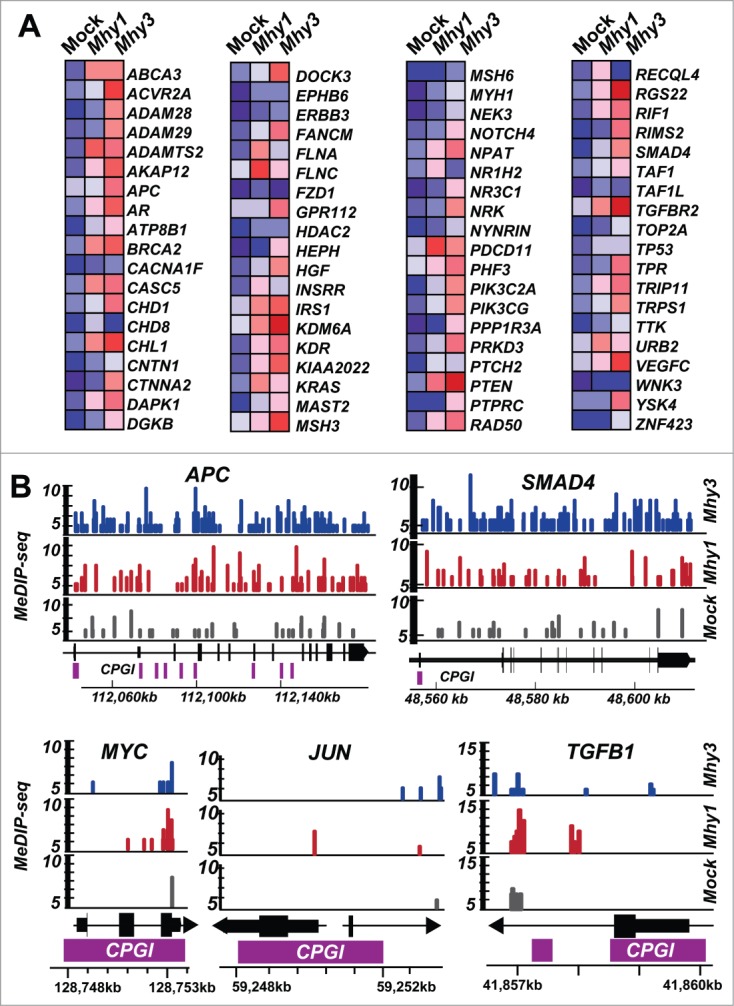
Figure 5.

Methylation of cancer-specific genes. (A) heatmap of the CG- and GATC-methylation in 76 cancer-specific genes in HT1080/Mhy1, HT1080/Mhy3 and HT1080/mock cells. Red and blue correspond to the high and the low methylation levels according to MeDIP, respectively. (B) MeDIP profiles of the selected gene loci. Solid color bars indicate the genomic position and MeDIP coverage of the individual CG- and GATC-methylation marks in HT1080/mock (gray), HT1080/Mhy1 (red) and HT1080/Mhy3 (blue) cells in the APC, SMAD4, MYC, JUN, and TGFB1 gene loci. Solid bars indicate exons (black) and CPGIs (purple). Chromosomal coordinates are shown at the bottom of the diagrams.
