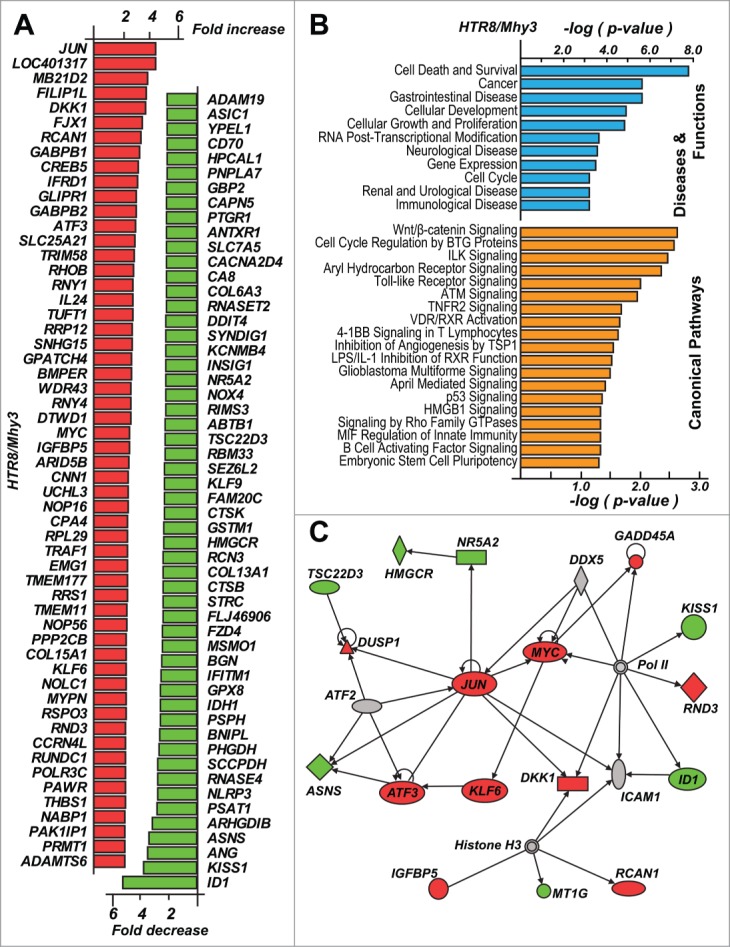
Figure 7.

Activation of the cancer-specific pathways in trophoblasts. (A) top up- and down-regulated genes in HRT8/Mhy3 cells relative to HTR8/mock cells. (B) affected disease (blue) and canonical pathways (orange) in HRT8/Mhy3 cells. The pathways with P ≤ 0.05 are shown. (C) proliferation specific regulatory network in HTR8/Mhy3 cells. Directly interacting molecules are connected by arrows. Up- and downregulated genes are in red and green, respectively.
