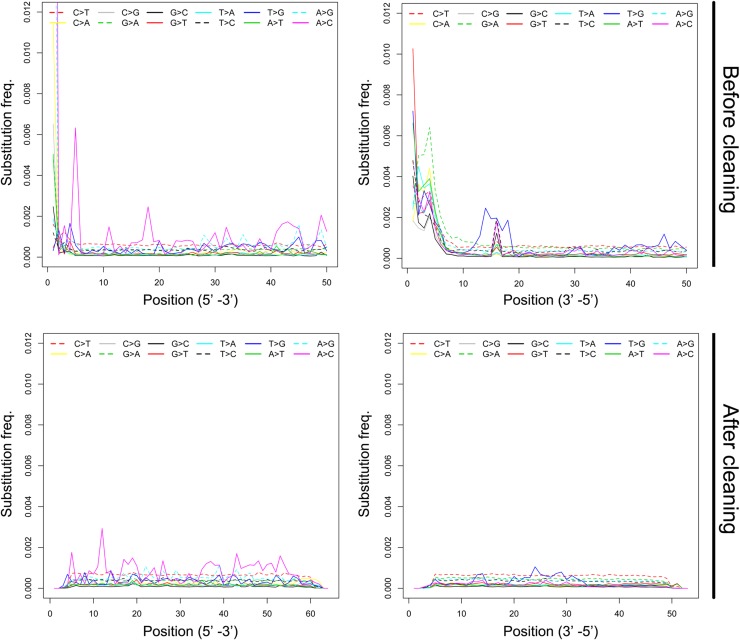
Fig 1. Patterns of mismatches in MVZ 214979 sequences.
The frequencies of the 12 types of mismatches (y-axis) are plotted as a function of distance from the 5′ and 3′ ends of the sequence reads (x-axis). The frequencies of each mismatch type are coded in different colors and line patterns. ‘After cleaning’ shows mismatch frequencies after deleting the first 50 bp form the end of each read.

