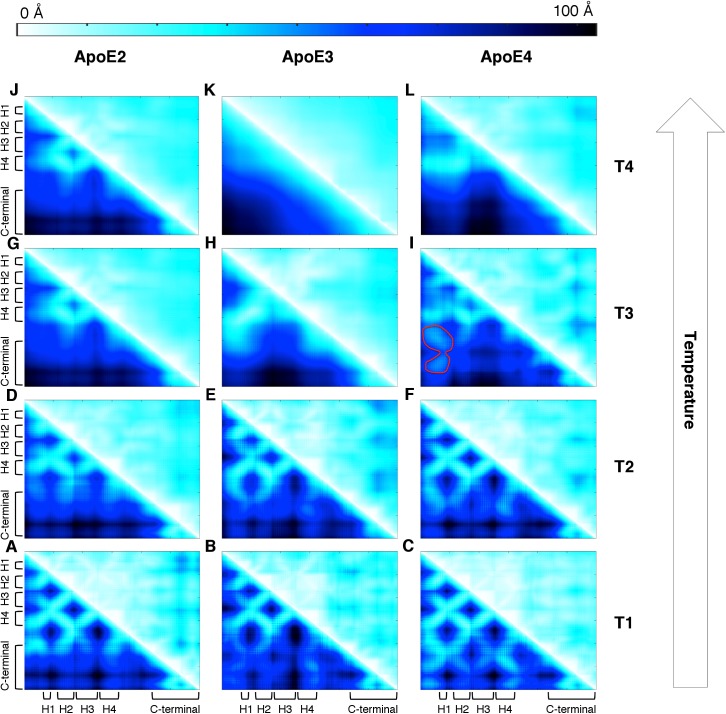
Fig 4. Temperature-dependent pair-wise inter-residue distances of ApoE isoforms.
(A-C) At T1 (~275 K for all three ApoE isoforms) and (D-F) at T2 (~321 K, ~318 K, and ~309 K for ApoE2, ApoE3 and ApoE4 respectively), all three isoforms exhibits the highest level of inter-residue contacts observed in the REX/DMD simulations, with ApoE4 having the highest density contacts. (G-I) At T3 (~340 K, ~338 K, and ~328 K for ApoE2, ApoE3 and ApoE4 respectively), all three isoforms exhibit a dramatic decrease in density of inter-residue contacts. ApoE4 displays a unique series of contacts (outlined in red) mediating the domain-domain interaction as discussed in the main text. (J-L) At T4 (~355 K, ~365 K, and ~342 K for ApoE2, ApoE3, and ApoE4, respectively), the majority of inter-residue contacts have been lost besides some transient contacts involving the N-terminal helix–4. The upper and lower triangular matrices represent respectively the average and the standard deviation of the pair-wise inter-residue distance in Å. The color bar represents the distance between the centroid computed over the residues’ side chains in Å.

