
Figure 3. Representative amplification plot (A) and derivative melting curves (B) of 10-fold serial diluted P. knowlesi target sequence.
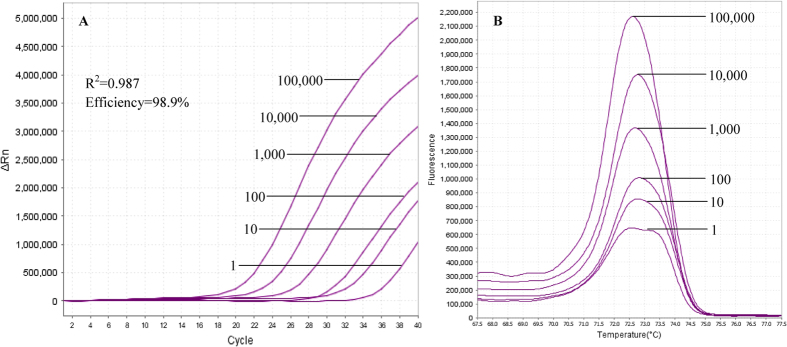
Ct values of six 10-fold serial diluted plasmid DNAs were subject to standard curve analysis using 7500 Software v2.0.1 (Applied Biosystems) and the r2 value and assay efficiency percentage were generated as 0.987 and 98.9%, respectively. The plots also show that the LOD of the assay for P. knowlesi is 1 copy number of target sequence.