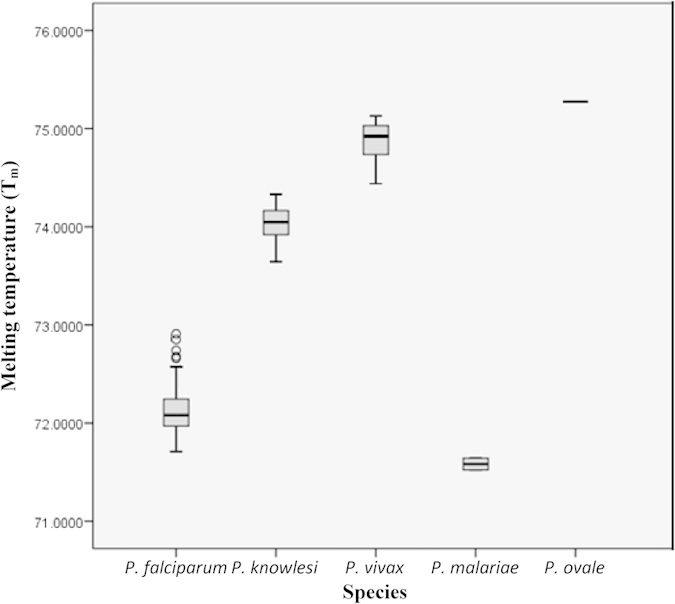
Figure 7. Box plot showing melting curve temperatures (Tm) for each Plasmodium spp.

Note that P. malariae and P. ovale had only 2 and 1 sample(s), respectively. Four outliers are noticed for P. falciparum. The ANOVA test showed significant difference of average Tm values between species (p = 0.001).
