
Figure 1. Principal components analysis (PCA) scores plots of PC 1 versus PC 2 for intracellular FT-IR metabolic fingerprints of HEPA-1 wild type (WT) (left) and C4 (right) cells exposed to 21% oxygen, 1%, 5% and 0% oxygen.
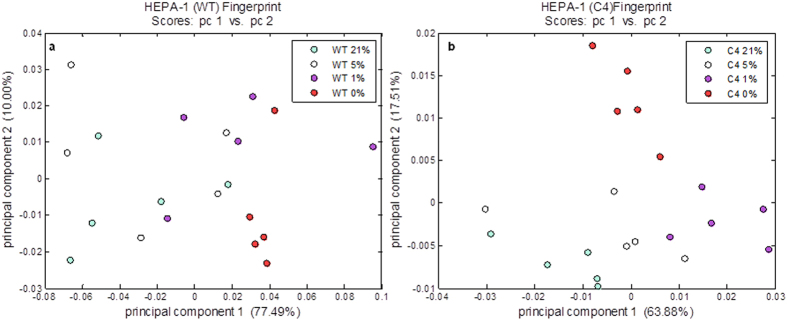
In both cell lines, intracellular profiles from 21% and 5% oxygen group and separate from 1% and 0% highlighting the similarity between 21% and 5%.