Figure 1.

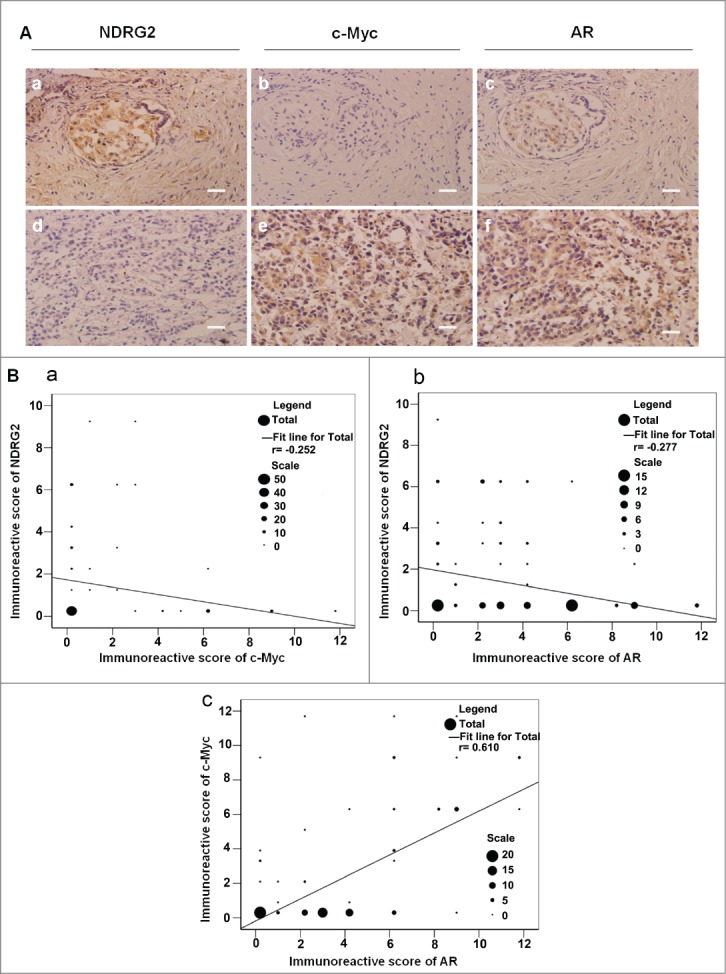
The expression levels of NDRG2 were negatively correlated with those of c-Myc and AR in prostate cancer tissues. (A) Immunohistochemical staining of the sections from human prostate cancer tissues with anti-NDRG2 (a, d), anti-AR (b, e) and anti-c-Myc (c, f) antibodies (Scale bar: 20 μm). The sections in a, b, c and those in d, e, f originated from the same paraffin blocks, respectively. Gleason score: a, b, c: 2 + 2 = 4; d, e, f: 3 + 4 = 7. (B) Statistical analysis of the expression levels among NDRG2, c-Myc and AR. The number of specimens is shown using ‘scale’. Disparities across groups were analyzed using the Pearson correlation coefficient, and the graph was generated using SPSS13.0 software (a: r = -0.252, P < 0.01; b: r = -0.277, P < 0.01; c: r = 0.610, P < 0.01).
