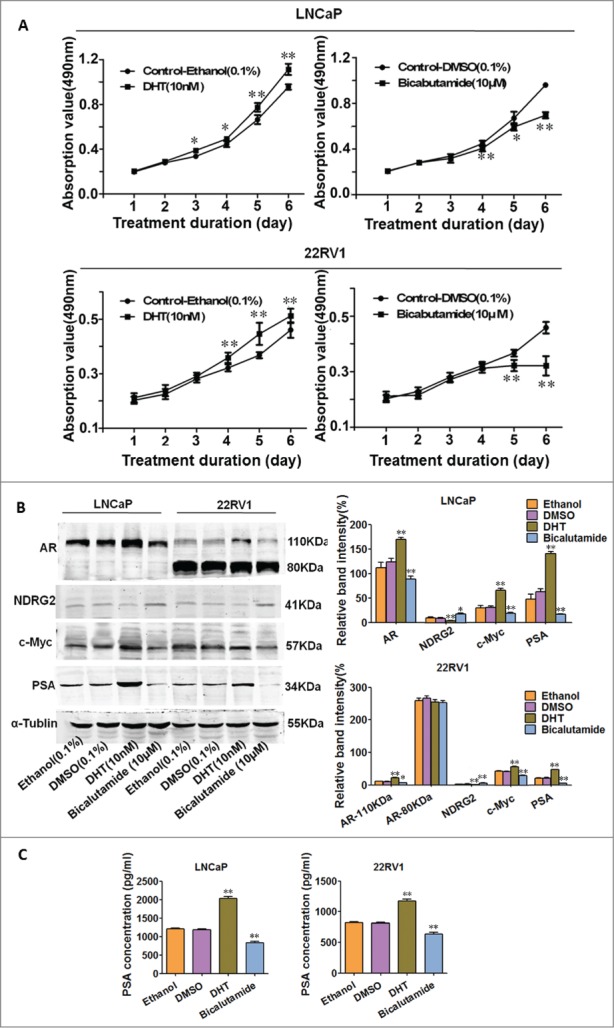
Figure 2.

AR activation or inhibition leads to alterations in AR, NDRG2, c-Myc and PSA in LNCaP and 22Rv1 cells. LNCaP and 22Rv1 cells were treated with vehicle controls (Ethanol or DMSO), DHT (10 nM), or bicalutamide (10 μM). (A) Cell growth curves were drawn based on the MTT assay (n = 6). (B) Western blot analysis of AR, c-Myc, NDRG2 and PSA protein levels with the corresponding antibodies. α-Tubulin protein levels were used as a loading control. Representative blots are shown, and the relative expression levels of the proteins normalized to α-tubulin were derived from 4 independent experiments (n = 4). (C) ELISA analysis of PSA secretion. The histograms were drawn based on the average values (n = 3). In A, B, and D, data indicate the mean ± SD *: P < 0.05; **: P < 0.01.
