
Fig. 6.
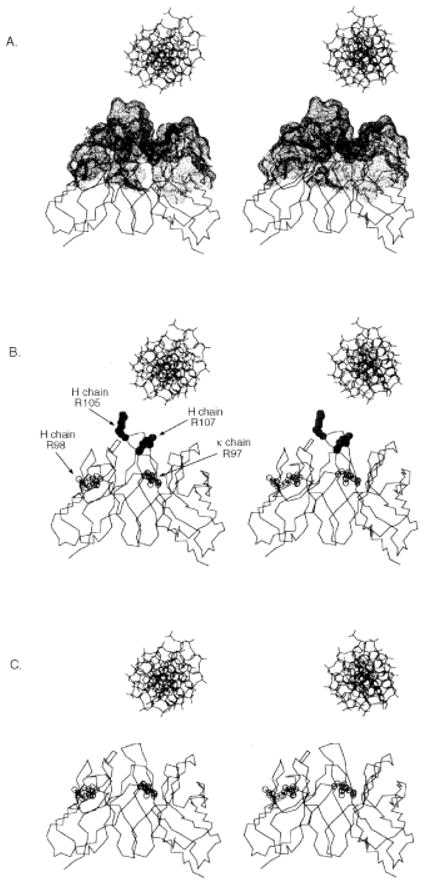
Stereo images of α-carbon trace drawings of the modeled mAb 412.67 Fv with B form DNA positioned above the binding site, drawn to scale. The molecular surface covering the CDR residues is depicted as dots (A). The H-CDR3 Arg 105 (R105) and 107 (R107) are depicted as full circles; the κ-CDR3 Arg97 (R97) and the H-FR3 Arg98 (R98) are depicted as open circles (B). The H-CDR3 Arg105 and Arg107 are substituted with Gly residues (C).