
Figure 1.
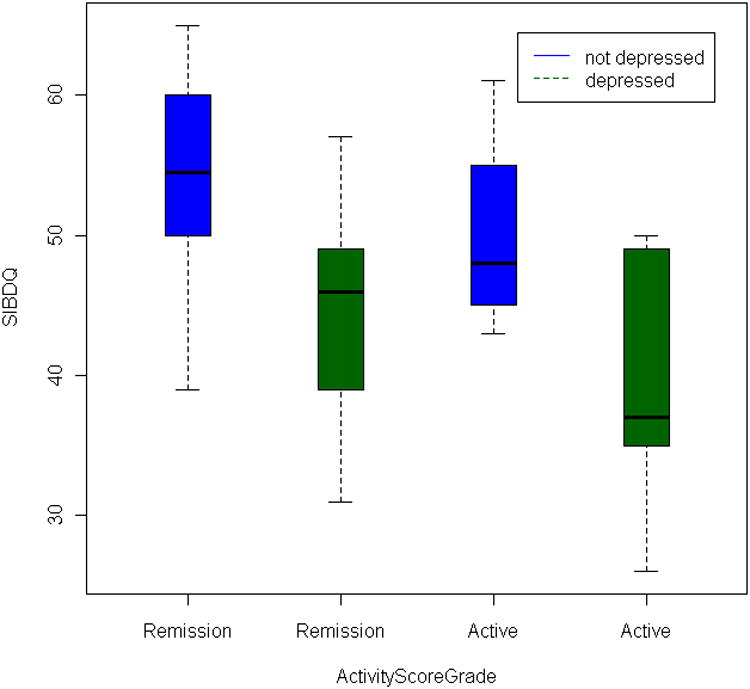
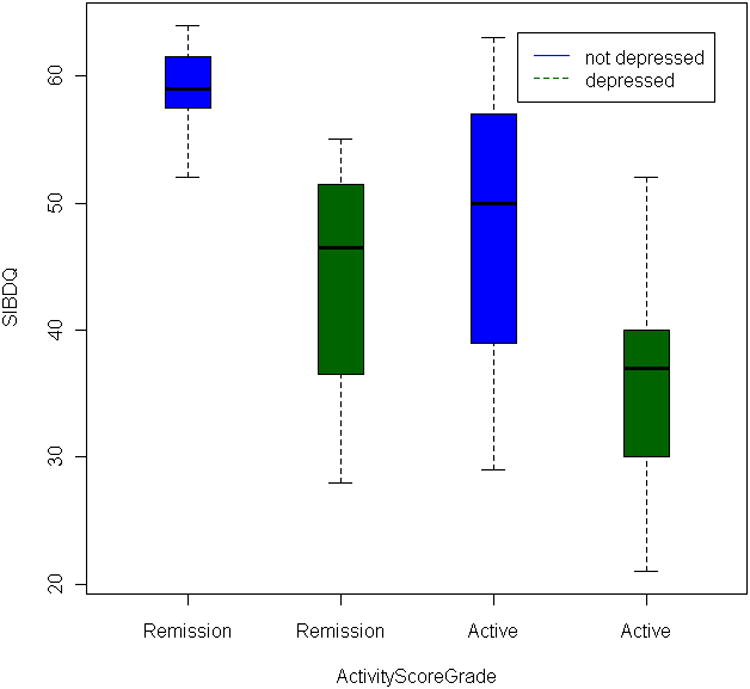
Boxplot of the effect of disease activity and depression score on SIBDQ. The y-axis displays the SIBDQ quality of life score, and x-axis displays the four categories classified by depression status and disease activity. The blue and green box shows patients without depression and with depression. The median SIBDQ score is displayed as the horizontal bar within each colored box.
A. Crohn's disease patients
B. Ulcerative Colitis patients