
Figure 4. Vascular endothelial (VE)-cadherin distribution in perfused microvessels.
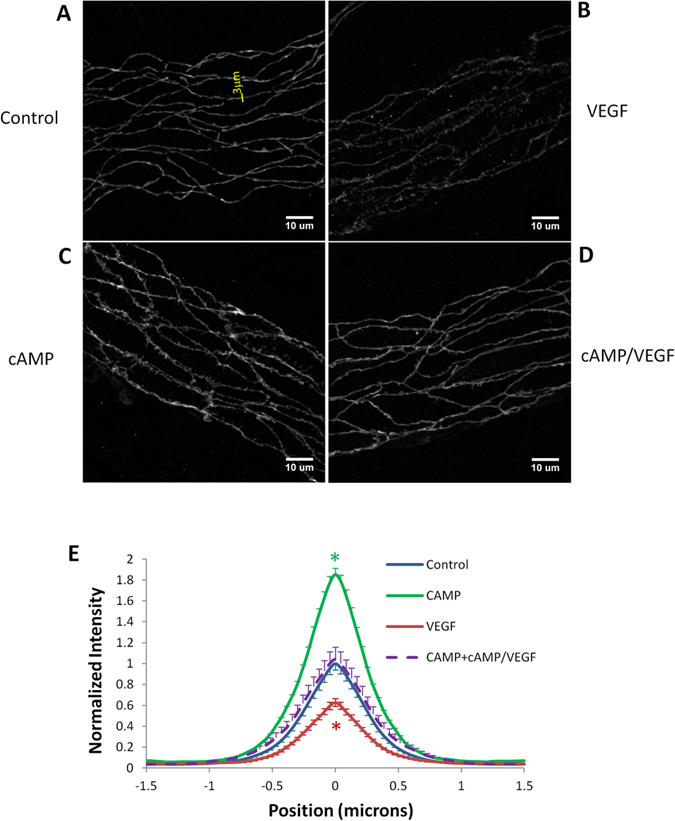
(A) In control vessels with 1% BSA-Ringer solution perfusate, the VE-cadherin label appeared as a continuous and smooth band; (B) in VEGF-treated vessels near the peak of the permeability response, the VE-cadherin label was nonuniform and discontinuous in some regions; (C) in cAMP-treated vessels, the VE-cadherin label was continuous, appeared in spikes and more intense compared with that in control vessels; (D) in vessels pretreated with cAMP, the VEGF treatment did not induce visible changes in the VE-cadherin label compared with control. (E) Normalized intensity profiles of VE-cadherin label distribution (along a 3 μm perpendicular line to the cell-cell junction, shown in A). For each treatment, there was a control vessel prepared and imaged during the same time. The peak intensity of the VE-cadherin label from the control vessel was used to normalized that in the treated vessel. n = 80 measured profiles from about 20 cell pairs for each vessel. n = 640 for the control group, n = 160 for the cAMP group, n = 240 for the VEGF group as well as the cAMP/VEGF group. *p < 0.05 compared with controls. Values are means ± SE.