
Figure 5. History of the East Asian Summer Monsoon indicated by magnetic susceptibility (MS).
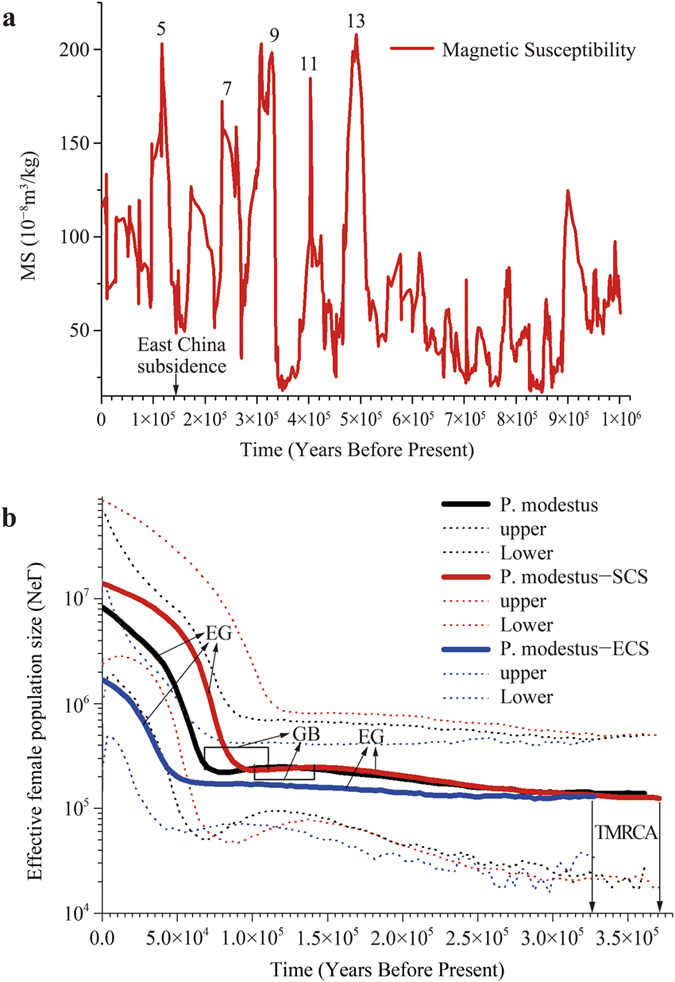
60 (a) and the demographic history of P. modestus, the East China Sea population and the South China Sea population (b). Thick lines show the medians of population sizes, and thin dotted lines indicate upper and lower 95% credibility intervals. Expansion growth (EG) and genetic bottleneck (GB) are indicated. The last five interglaciations (isotopic stages 5, 7, 9, 11 and 13) are labelled in (a).