Figure 1.

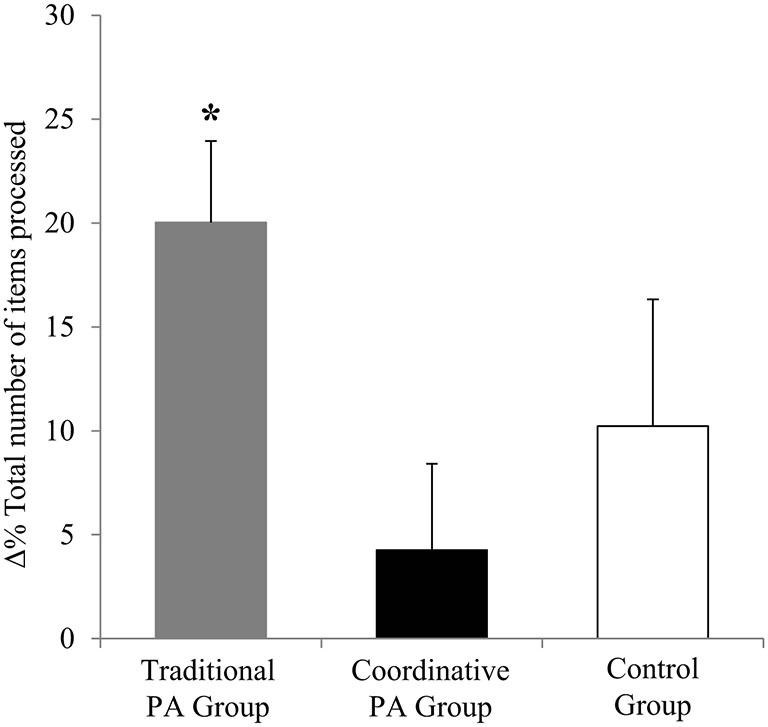
Percentage of variation (Δ%) of the total number of items processed (± SEM). *P < 0.05 Traditional PA Group vs. Coordinative PA Group.

Percentage of variation (Δ%) of the total number of items processed (± SEM). *P < 0.05 Traditional PA Group vs. Coordinative PA Group.