
Figure 2.
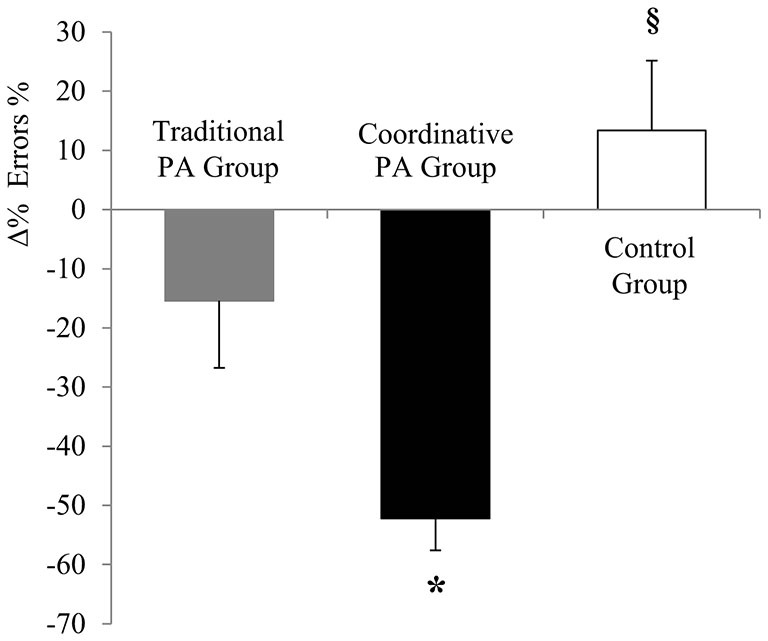
Percentage of variation (Δ%) of the percentage of errors (% errors) (± SEM). *P < 0.05 Coordinative PA Group vs. Traditional PA Group; §P < 0.05 Control Group vs. Coordinative PA Group vs. Traditional PA Group.
Official websites use .gov
A
.gov website belongs to an official
government organization in the United States.
Secure .gov websites use HTTPS
A lock (
) or https:// means you've safely
connected to the .gov website. Share sensitive
information only on official, secure websites.
Percentage of variation (Δ%) of the percentage of errors (% errors) (± SEM). *P < 0.05 Coordinative PA Group vs. Traditional PA Group; §P < 0.05 Control Group vs. Coordinative PA Group vs. Traditional PA Group.