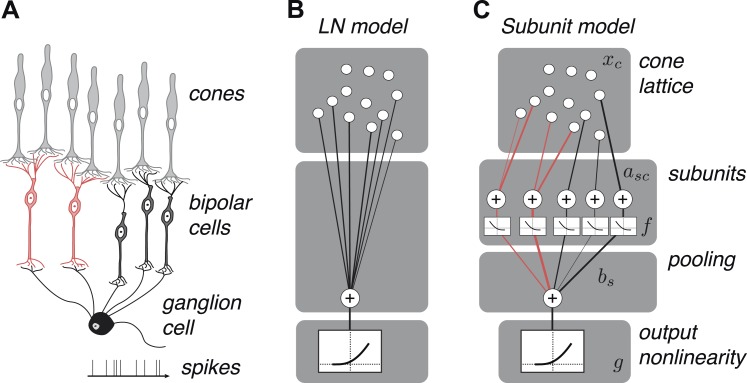
Figure 2. OFF midget RGC anatomy and modeling framework.
(A) Bipolar cells receive convergent input from cones, and ganglion cells receive convergent input from bipolar cells. (B) A linear–nonlinear (LN) model describes the RGC response with one stage of linear integration of cone inputs, followed by a nonlinearity. White disks indicate cones, black line indicates integration weights. (C) The subunit model describes the RGC response with two stages of linear integration and nonlinearity; subunits perform initial integration following by a nonlinearity (common to all subunits). Red, subunits receiving input from two cones; black, subunits receiving input from one cone. Cones are indexed by c, subunits by s. xc is the input to each cone. asc is the weight from cone c to subunit s. bs is the weight on each subunit. f and g are the subunit and spiking nonlinearities, respectively. See ‘Materials and methods’ for details on parameterization and fitting.

