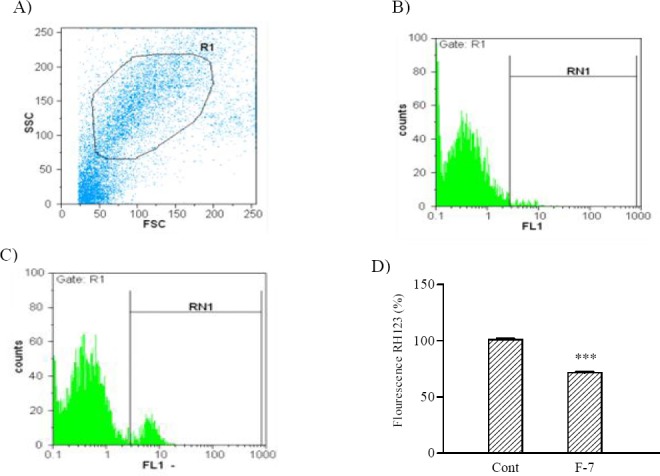
Fig. 1.

Effect of F7on MMP alteration in SKNMC cells. A; Dot plot in arbitrary unit on a linear scale. Each dot represents the Forward-scattered light (FSC) and Side-scattered light (SSC) value for a single SKNMC cells. B; Untreated cells, C; Cells treated with indicated concentration of F7 for 24 h. D; Column bar graph of mean cell florescent for rhodamine 123. Data are expressed as the mean ± S.E.M of three separate experiments. #P<0.05 vs. Control, *P<0.05 vs. doxorubicin treated cells.
