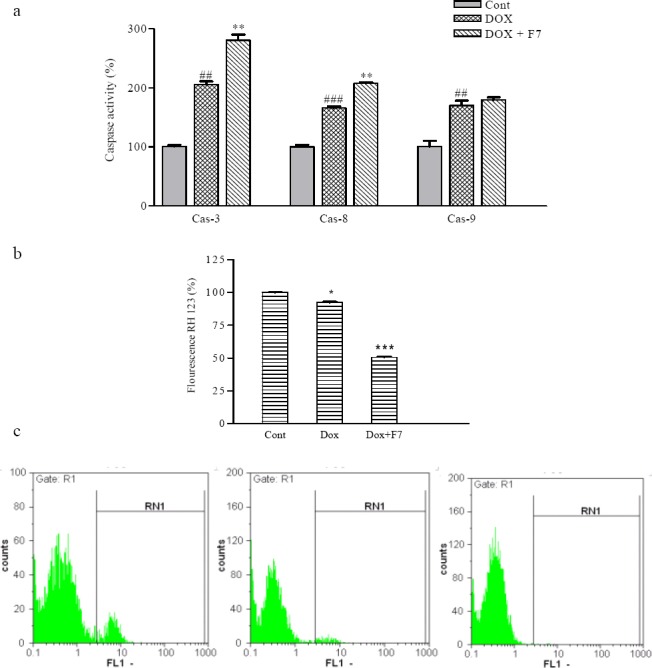
Fig. 5.

The effect of F7on a; caspases activity, b and c; on mitochondrial membrane potential in the presence and absence of doxorubicin in SKNMC cells ##P<0.01 and ###P<0.001 vs. control, *P<0.05, and **P<0.01, ***P<0.001 vs. doxorubicin-treated cells.
