
Figure 3. Uptake mechanism.
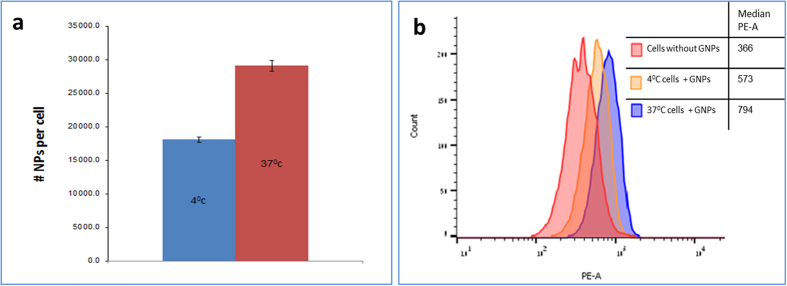
(a) FAAS quantification of GNPs after half an hour incubation with cancer cells, under different temperature conditions (4 °C and 37 °C). Significant difference in gold amounts between the two temperatures (p < 0.01). (b) Representative histograms of GNP binding and uptake in cancer cells determined by flow cytometry (FACS). Red line: control cancer cells (without GNPs), orange line: cancer cells loaded with GNPs in 4 °C; blue line: cancer cells loaded with GNPs in 37 °C.