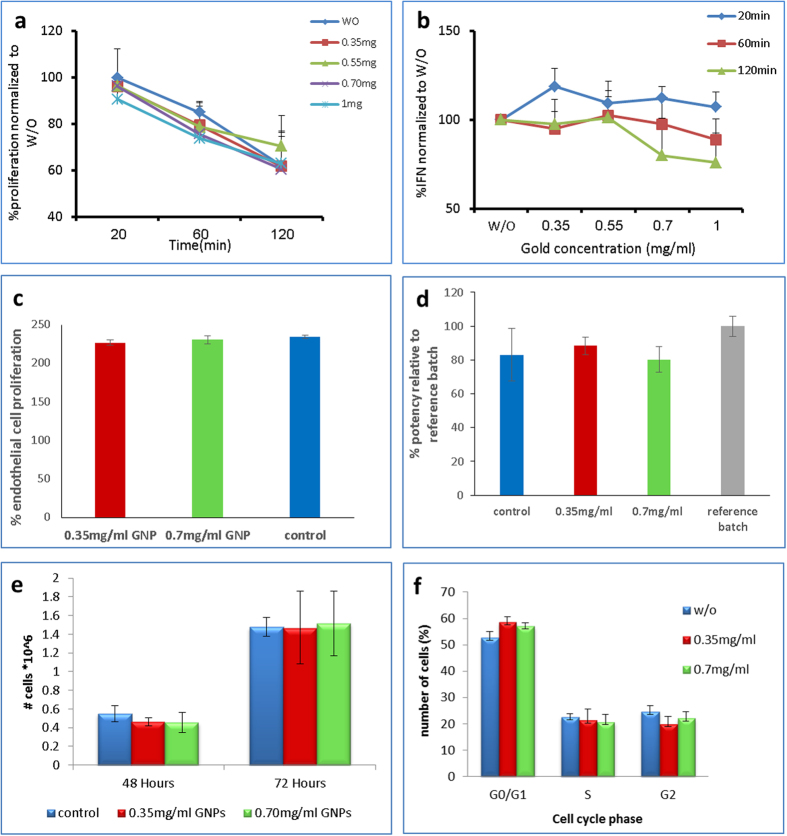
Figure 4. Cell proliferation and functionality assays for immune-cells (a,b), stem cells (c,d) and cancer cells (e,f).
T-cells: (a) Proliferation assay. CFSE-labeled T-cells loaded with 0.35, 0.55, 0.70 and 1 mg/ml GNP concentrations, stimulated for 3 days and analyzed for CFSE dilution. Data shown as average percentage of proliferative cells, normalized to control (cells w/o GNPs) ± SEM. No significant differences observed between cells loaded with the different amounts of GNPs and controls (p > 0.05). (b) Functionality. T-cells loaded with 0.35, 0.55, 0.70 and 1 mg/ml GNP concentrations, co-cultured with positive target tumor cell line (888-A2) for 120 minutes. IFN-γ secretion (measured by ELISA) was normalized to control (cells w/o GNPs) ±SEM (n = 3) (p < 0.05, Student’s paired t-test). Cell-function was impaired only for high gold concentrations (0.75, 1 mg/mL) after 120 min of incubation (c,d) PLX-PAD cells. (c) Endothelial cell-proliferation assay. Cells loaded with 0.35 and 0.70 mg/ml GNP concentrations were grown for 48 h. Medium was changed to endothelial growth medium under hypoxic conditions for 24 hours before collection of conditioned medium (CM) (used to examine endothelial cell proliferation). Amount of viable cells after 4 days in culture with PLX-PAD derived CM was determined using the Alamar blue assay. (d) Cell adhesion assay. Following staining with 0.35 and 0.70 mg/ml GNP concentrations, Cells were left to adhere for 6 hours. Relative amount of viable adherent cells was determined using Cyquant. The adherence of cells was determined relative to the reference sample. No significant differences in endothelial cell proliferation and adherence were observed between CM derived from cells loaded with the different amounts of GNPs (p > 0.05). (e,f) A-431 cells. (e) Cell viability changes during 72 hours of A-431 cells loaded with 0.35 and 0.7 mg/ml GNP concentrations. Viable cells were identified by Trypan Blue-dye exclusion viability assay. Results presented as mean ± SEM (n = 3). (f) cell-cycle analysis. A-431 cells loaded with 0.35 and 0.70 mg/ml GNP concentrations were incubated for 48 h. Cells were then harvested, washed and fixed for 24 h. Data was analyzed using flow-cytometry. Results presented as mean ± SEM (n = 3). No significant differences in proliferation and viability were observed between cells loaded with the different amounts of GNPs (p > 0.05).

