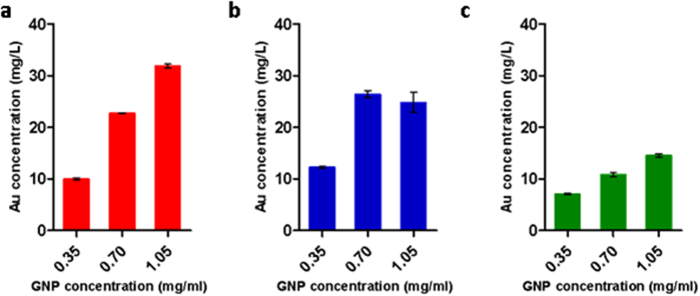
Figure 7. Cellular uptake of GNPs as a function of gold concentration.
Each cell type was incubated with GNPs at three different concentrations (0.35, 0.7, and 1.05 mg/ml), for 1 h. The actual amount of gold uptake was quantified using FAAS analysis (significant difference between different gold amounts (p < 0.001), except for high GNP concentration in T-Cells (p > 0.05)). (a) Stem cells. (b) Immune cells. (c) Cancer cells. Results presented as mean ± SEM (n = 3).

