Fig. 6.
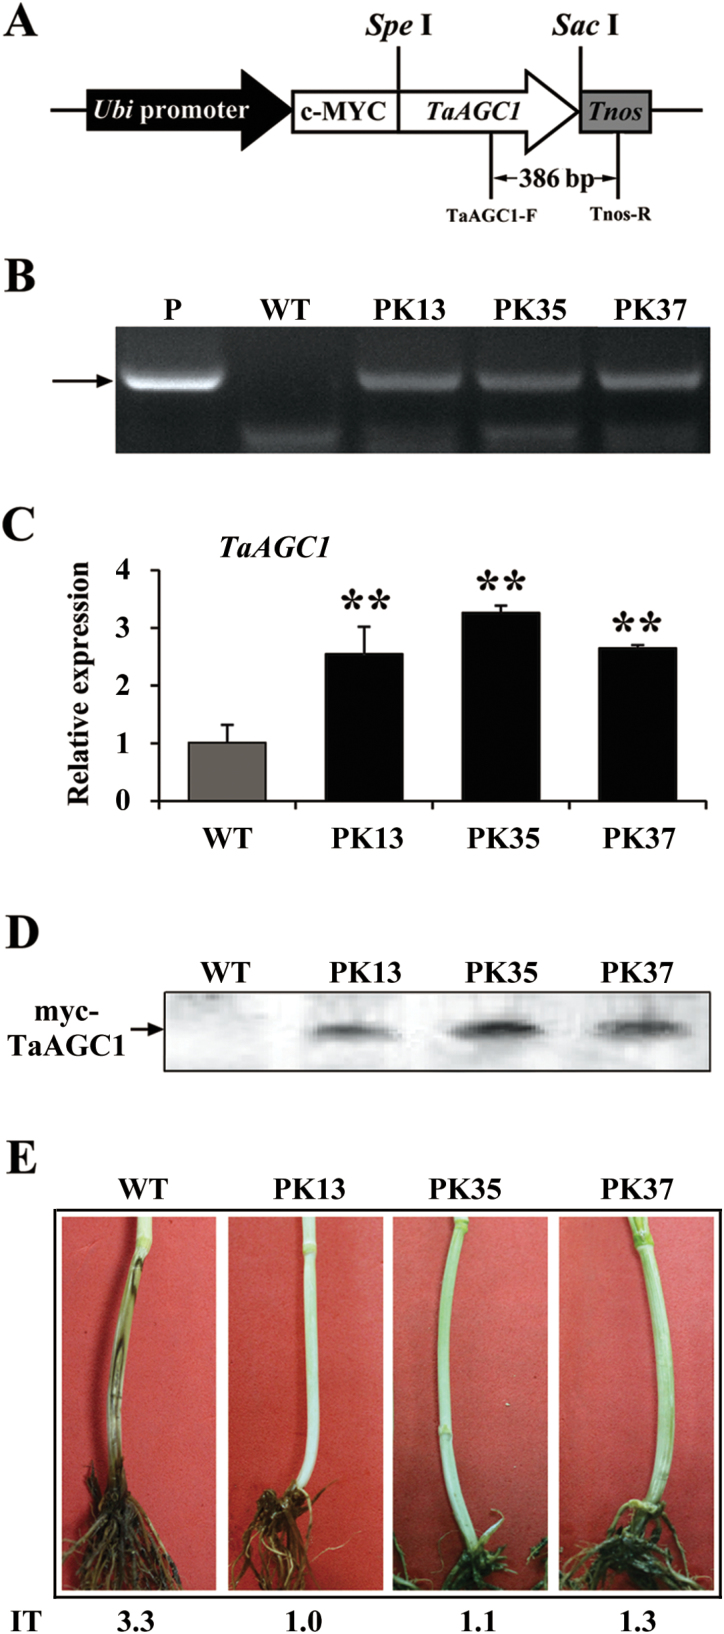
Molecular analyses and Rhizoctonia cerealis responses of the wheat (Triticum aestivum) AGC kinase gene TaAGC1-overexpressing transgenic wheat plants. (A) TaAGC1-overexpressing transformation vector pUBI:myc-TaAGC1. The arrow indicates the fragment amplified in the PCR detection of the transgene. (B) PCR pattern of three TaAGC1-overexpressing transgenic lines (PK13, PK35 and PK37) and wild-type (WT) wheat Yangmai 20 using the TaAGC1-overexpressing transgene specific primers. P, the transformation vector pUBI:myc-TaAGC1 as a positive control. (C) qRT-PCR analyses of the relative transcript levels of TaAGC1 in three TaAGC1 transgenic lines at 7 d post R. cerealis inoculation. The relative transcript level of TaAGC1 in transgenic lines is relative to that in the WT plants. Three biological replicates per line were averaged and statistically treated (t-test; ** P<0.01). Bars indicate standard error of the mean. (D) Western blot pattern of the three TaAGC1-overexpressing transgenic lines and WT Yangmai 20 using an anti-myc antibody. Similar results were obtained from three independent replicates. (E) Typical symptoms of sharp eyespot in the three TaAGC1-overexpressing transgenic and WT Yangmai 20 plants. IT indicates infection type. (This figure is available in colour at JXB online.)

