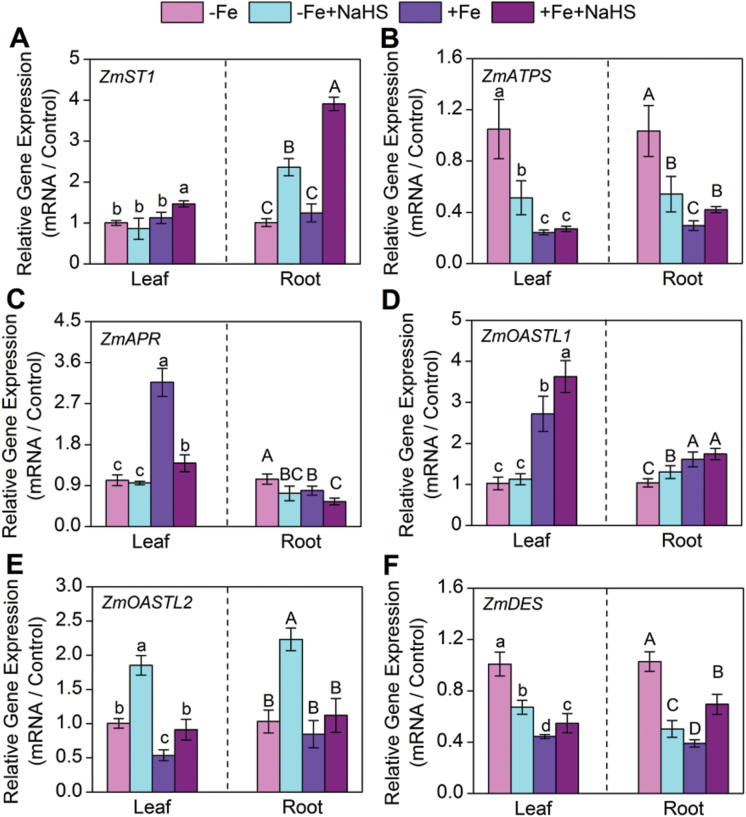
Fig. 8.
Gene expression of ZmST1 (A), ZmATPS (B), ZmAPR (C), ZmOASTL1 (D), ZmOASTL2 (E), and ZmDES (F) of maize leaves (left column) and roots (right column) with different treatments. Maize seedlings were pre-treated with 100 µM NaHS for 8 d and then grown in a nutrient solution containing 1 µM Fe(III)-EDTA or 50 µM Fe(III)-EDTA for 12 d. The relative mRNA level of each gene was normalized to the mRNA of Zmactin2. Data are presented as means ± SE of three replicates. Columns labelled with different letters indicate significant differences at P<0.05. –Fe, 1 µM Fe; –Fe+NaHS, seedlings were pre-treated with 100 µM NaHS and then treated with 1 µM Fe; +Fe, 50 µM Fe; +Fe+NaHS, seedlings were pre-treated with 100 µM NaHS and then treated with 50 µM Fe. A colour version of this figure is available at JXB online.

