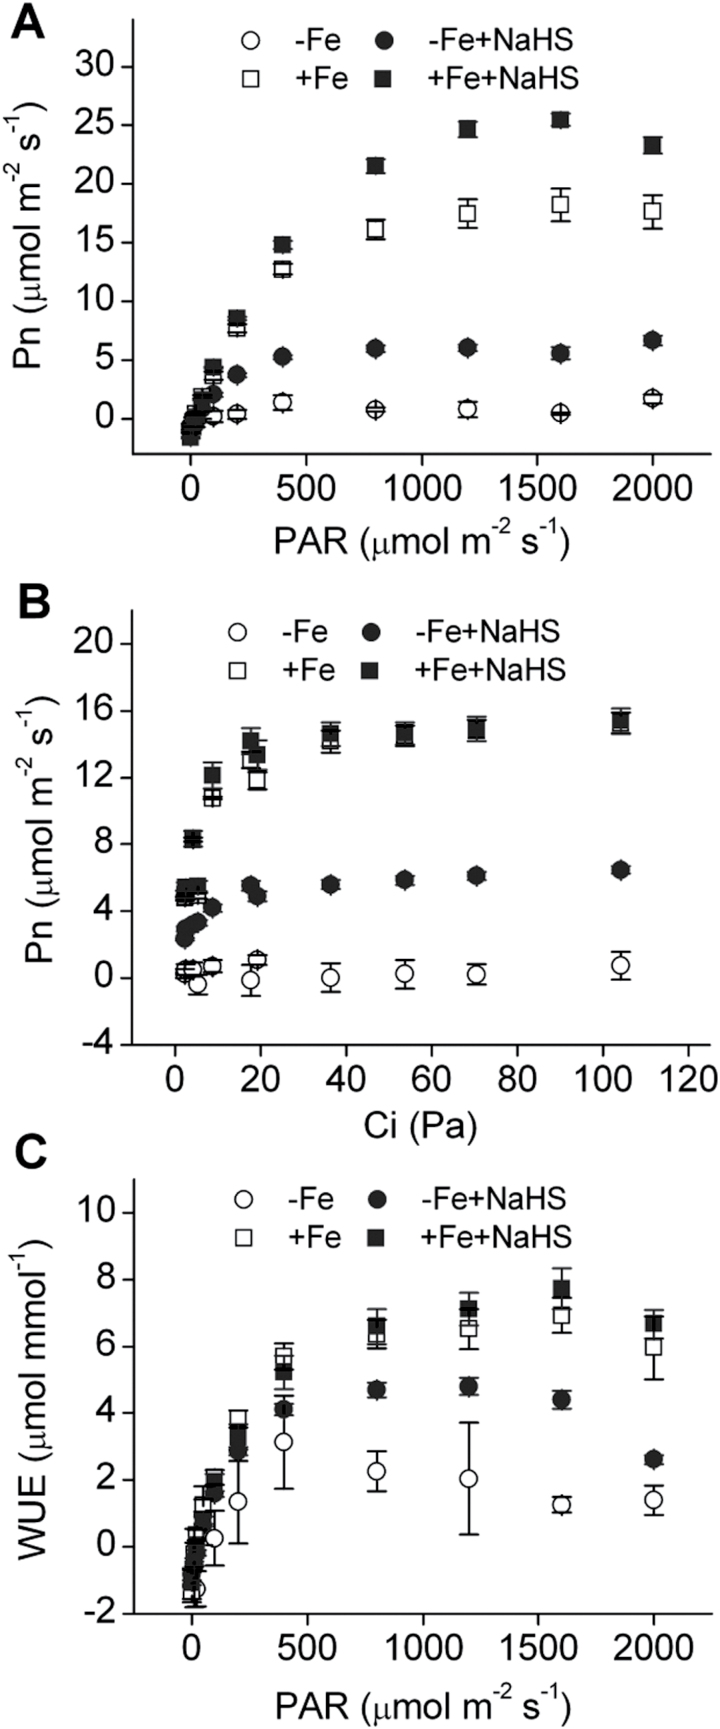
Fig. 9.
Light-response curve (A), Intercellular CO2-response curve (B), and WUE-response curve (C) of maize plants grown under iron-deficient conditions. Maize seedlings were pre-treated with 100 µM NaHS for 8 d and then grown in a nutrient solution containing 1 µM Fe(III)-EDTA or 50 µM Fe(III)-EDTA for 12 d. Data are presented as means ± SE. –Fe, 1 µM Fe; –Fe+NaHS, seedlings were pre-treated with 100 µM NaHS and then treated with 1 µM Fe; +Fe, 50 µM Fe; +Fe+NaHS, seedlings were pre-treated with 100 µM NaHS and then treated with 50 µM Fe.

