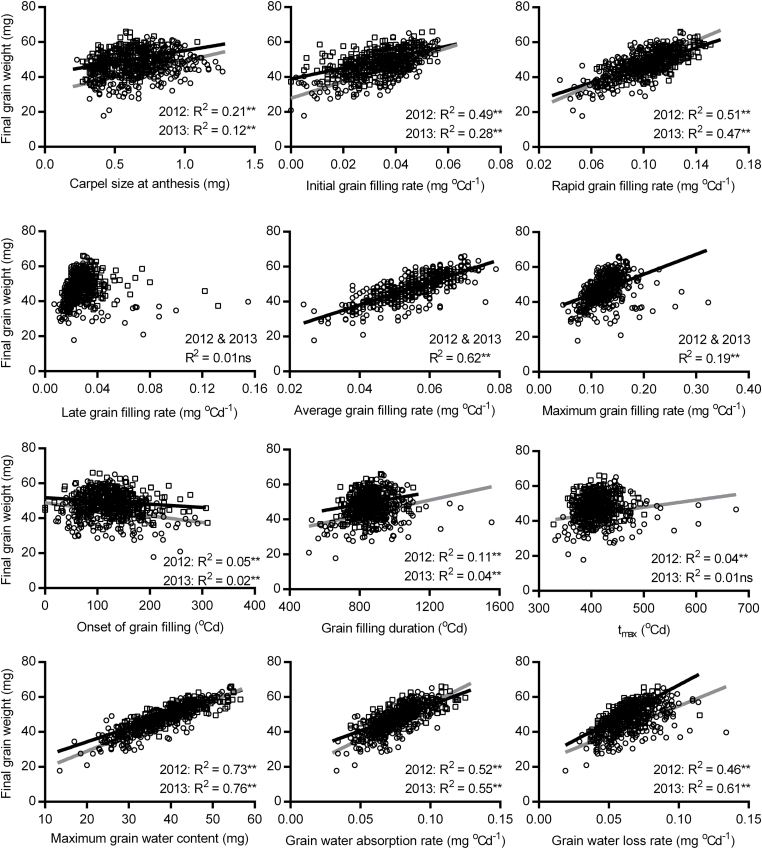
Fig. 2.
Relationships between carpel size at anthesis, grain dry matter and water accumulation, and final grain weight. Data in 2012 and 2013 are indicated by the circles (grey regression lines) and squares (black regression lines), respectively. Significance levels for regression analysis: ns, not significant; *P<0.05; **P<0.01. A common line is used to explain both years in the graphs indicated by ‘2012 & 2013’ if there are no significant differences in slopes and intercepts between two separate lines. Trait abbreviation: t max, time at the maximum grain filling rate.

